-
Let me point out few useful facts about $\operatorname{curl}.$
- For a differentiable scalar function $f$ we have that \[ \operatorname{curl}\bigl(\operatorname{grad} f\bigr) = \boldsymbol{0}. \] Therefore adding a gradient field to a vector field $\boldsymbol{F}$ will not change its curl: \[ \operatorname{curl} \boldsymbol{F} = \operatorname{curl}\bigl(\boldsymbol{F} + \operatorname{grad} f\bigr). \] Written with the coordinate functions this equality reads \[ \operatorname{curl} \langle F_1, F_2, F_3 \rangle = \operatorname{curl} \langle F_1 + f_x, F_2 +f_y , F_3 + f_z \rangle. \] In the above equality $f$ can be any scalar function.
- The fact from the previous item can be used to solve a problem like this: Find a vector field \[ \boldsymbol{G} = \langle G_1, G_2, 0 \rangle \] such that \[ \operatorname{curl} \boldsymbol{G} = \operatorname{curl}\bigl\langle 3 y z, 2 x z + y, x y + 2 z \bigr\rangle. \] Using the property from the previous item we need to find a scalar function $f$ such that \[ x y + 2 z + f_z = 0. \] There are many such functions $f.$ The simplest one is $f(x,y,z) = -xyz-z^2.$ Thus, one function $\boldsymbol{G}$ that satisfies the given requirements is \[ \boldsymbol{G} = \bigl\langle 2 y z, x z + y, 0 \bigr\rangle. \]
- Using the property from the first item we can develop a strategy for answering questions like this: Find a vector field $\boldsymbol{G}$ such that \[ \operatorname{curl} \boldsymbol{G} = \bigl\langle 2 y z, 5 y - x z, x - 5 z \bigr\rangle. \] By the first item we can look for $\boldsymbol{G}$ such that \[ \boldsymbol{G} = \langle G_1, G_2, 0 \rangle. \] Then we have the equality \[ \Bigl\langle -\frac{\partial G_2}{\partial z}, \frac{\partial G_1}{\partial z}, \frac{\partial G_2}{\partial x} - \frac{\partial G_1}{\partial y} \Bigr\rangle = \bigl\langle 2 y z, 5 y - x z, x - 5 z \bigr\rangle. \] That is, we need to find two functions $G_1$ and $G_2$ which satisfy the partial differential equations: \[ -\frac{\partial G_2}{\partial z} = 2 y z, \quad \frac{\partial G_1}{\partial z} = 5 y - x z, \quad \frac{\partial G_2}{\partial x} - \frac{\partial G_1}{\partial y} =x - 5 z. \] From the first and the second equations we get \[ G_2(x,y,z) = - yz^2 + a(x,y), \quad G_1(x,y,z) = 5yz -\frac{1}{2} xz^2 + b(x,y). \] Substituting these in the third differential equation we get \[ \frac{\partial a}{\partial x} - 5z - \frac{\partial b}{\partial y} = x - 5 z. \] There are many functions $a(x,y)$ and $b(x,y)$ which satisfy this equation. We just need one $a$ and one $b$. We can take \[ a(x,y) = \frac{1}{2} x^2, \quad b(x,y) = 0. \] Thus, we found out that \[ \boldsymbol{G} = \Bigl\langle 5yz -\frac{1}{2} xz^2, - yz^2 + \frac{1}{2} x^2, 0 \Bigr\rangle \] is a vector potential of $\bigl\langle 2 y z, 5 y - x z, x - 5 z \bigr\rangle.$ This can be easily verified by calculating the curl of $\boldsymbol{G}.$
- For Section 20.3 do these problems 1, 3, 5, 7, 8, 11, 13, 14, 15-18, 20, 22, 23, 24, 25, 26, 27, 29. For Exercises 1 and 3 find a potential for the given vector field. For Exercises 7 and 11 find a vector potential for the given vector field. For Problem 25 find a potential for the vector field $\boldsymbol{E}.$
- For Section 20.2 do these problems 1, 5, 7, 8, 9, 11, 13, 16, 17, 19, 21, 22, 23, 25, 26, 27, 28, 29, 30, 31, 33, 34, 35, 37. Notice that 31 is an interesting problem since both sides of Stoke's Theorem seems difficult to evaluate. However, it is much easier to evaluate the circulation. You only need to notice that all the terms in the Riemann integral obtained from the circulation integral are periodic with period $2\pi$ and either odd or even.
- We started Section 20.1 on Tuesday. Do these problems 1, 3, 4, 5, 8, 9, 13, 14-17, 19, 21, 25, 27, 28, 29, 30, 31, 32, 33.
-
In this item I will discuss the following remarkable theorem:
Below is a polyhedron with six faces with the outward-pointing area vectors emphasized in different colors. The theorem claims that the sum of these area vectors is the zero vector.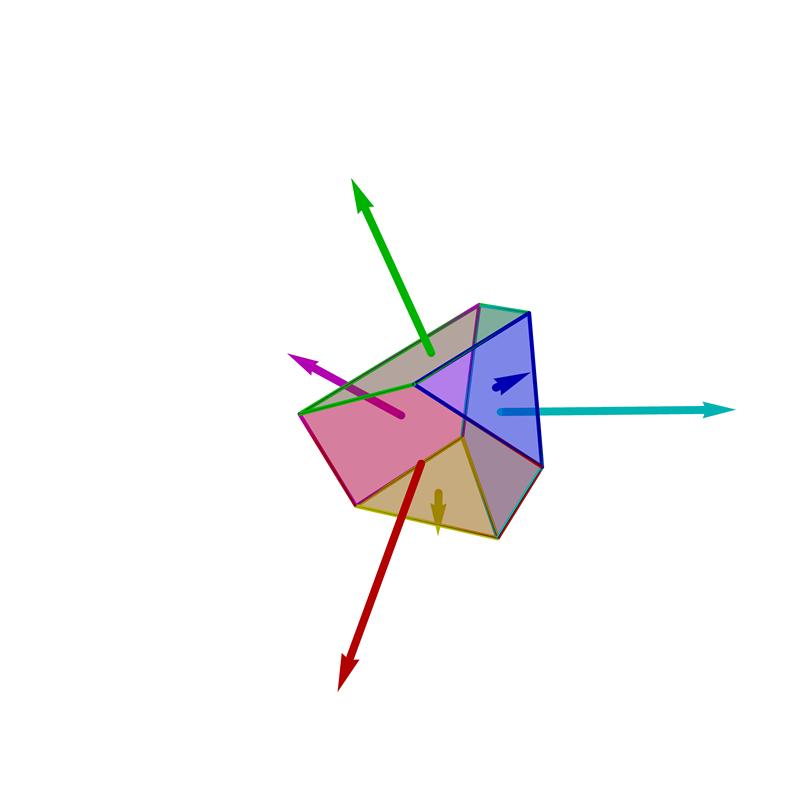
The next animation provides a visual proof of the theorem for a tetrahedron.Place the cursor over the image to start the animation.
We use the picture below to give an algebraic proof of the theorem for a tetrahedron.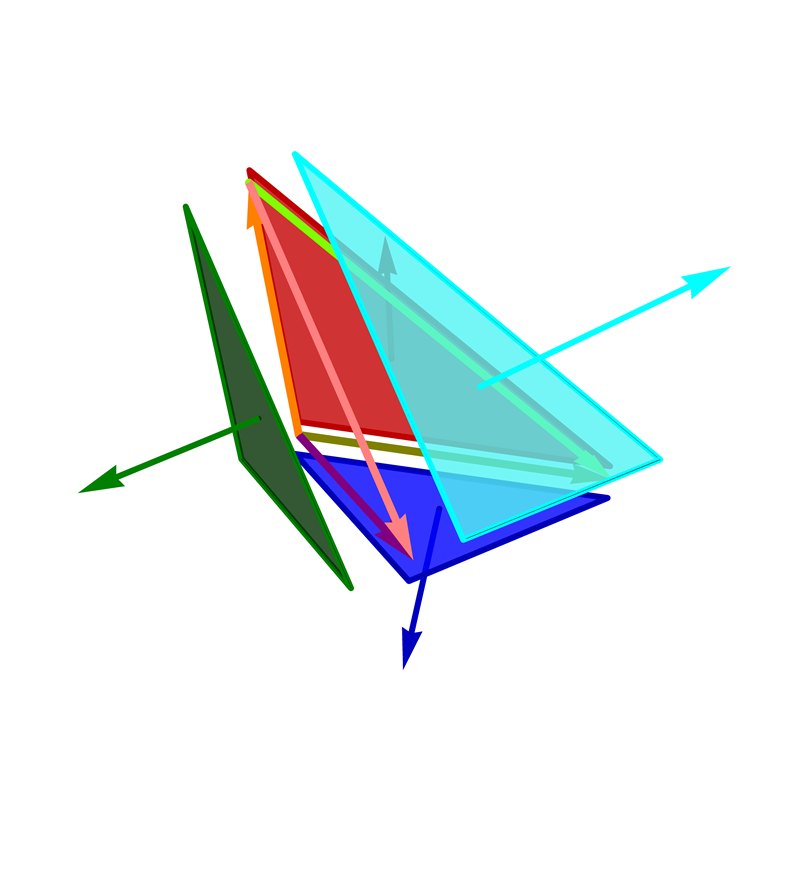 Next, we introduce notation for the colored vectors in the picture above. Denote the purple vector by $\vec{a},$ the olive vector by $\vec{b}$ and the orange vector by $\vec{c}.$ Then the pink vector is $\vec{a} - \vec{c}$ and the chartreuse vector is $\vec{b} - \vec{c}.$ Based on the definition of the cross product, the green area vector equals $(1/2) (\vec{a} \times \vec{c}),$ the blue area vector equals $(1/2)(\vec{b} \times \vec{a}),$ the red area vector equals $(1/2)(\vec{c} \times \vec{b})$ and the cyan area vector equals
$$
(1/2)\bigl((\vec{a} - \vec{c}) \times (\vec{b} - \vec{c})\bigr) = (1/2) (\vec{a} \times \vec{b}) - (1/2) (\vec{a} \times \vec{c}) - (1/2) (\vec{c} \times \vec{b}).
$$
Hence the sum of the four area vectors is
\begin{multline*}
(1/2) (\vec{a} \times \vec{c}) + (1/2)(\vec{b} \times \vec{a}) + (1/2)(\vec{c} \times \vec{b}) \\
+ (1/2) (\vec{a} \times \vec{b}) - (1/2) (\vec{a} \times \vec{c}) - (1/2) (\vec{c} \times \vec{b}) = \vec{0}.
\end{multline*}
This proves the theorem for a tetrahedron.
Next, we introduce notation for the colored vectors in the picture above. Denote the purple vector by $\vec{a},$ the olive vector by $\vec{b}$ and the orange vector by $\vec{c}.$ Then the pink vector is $\vec{a} - \vec{c}$ and the chartreuse vector is $\vec{b} - \vec{c}.$ Based on the definition of the cross product, the green area vector equals $(1/2) (\vec{a} \times \vec{c}),$ the blue area vector equals $(1/2)(\vec{b} \times \vec{a}),$ the red area vector equals $(1/2)(\vec{c} \times \vec{b})$ and the cyan area vector equals
$$
(1/2)\bigl((\vec{a} - \vec{c}) \times (\vec{b} - \vec{c})\bigr) = (1/2) (\vec{a} \times \vec{b}) - (1/2) (\vec{a} \times \vec{c}) - (1/2) (\vec{c} \times \vec{b}).
$$
Hence the sum of the four area vectors is
\begin{multline*}
(1/2) (\vec{a} \times \vec{c}) + (1/2)(\vec{b} \times \vec{a}) + (1/2)(\vec{c} \times \vec{b}) \\
+ (1/2) (\vec{a} \times \vec{b}) - (1/2) (\vec{a} \times \vec{c}) - (1/2) (\vec{c} \times \vec{b}) = \vec{0}.
\end{multline*}
This proves the theorem for a tetrahedron.
-
In this item I want to explain the connection between the geometric and the coordinate definition of the curl of a vector field.
In the previous item proved that the sum of the area vectors of the four faces of a tetrahedron is the zero vector.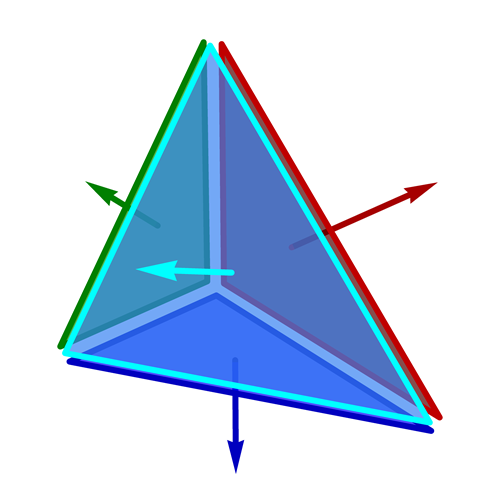 Consider the tetrahedron in the above picture. This tetrahedron has the following properties: its blue face is orthogonal to the coordinate vector $\vec{k}$ (or, equivalently, parallel with $xy$-plane), its green face is orthogonal to the coordinate vector $\vec{\jmath}$ (or, equivalently, parallel with $zx$-plane), its red face is orthogonal to the coordinate vector $\vec{\imath}$ (or, equivalently, parallel with $yz$-plane). Denote by $\vec{n}$ the unit normal vector to the cyan face of the pictured tetrahedron. Denote by $A_r$, $A_g$, $A_b$ and $A_c$ the areas of the red face, green face, blue face and cyan face, respectively. Then we have
\begin{equation*}
- A_r \vec{\imath} -A_g \vec{\jmath} - A_b \vec{k} + A_c \vec{n} = \vec{0}.
\end{equation*}
Consequently,
\begin{equation*}
A_c \vec{n} = A_r \vec{\imath} + A_g \vec{\jmath} + A_b \vec{k} = \bigl\langle A_r, A_g, A_b \bigr\rangle.
\end{equation*}
Consider the tetrahedron in the above picture. This tetrahedron has the following properties: its blue face is orthogonal to the coordinate vector $\vec{k}$ (or, equivalently, parallel with $xy$-plane), its green face is orthogonal to the coordinate vector $\vec{\jmath}$ (or, equivalently, parallel with $zx$-plane), its red face is orthogonal to the coordinate vector $\vec{\imath}$ (or, equivalently, parallel with $yz$-plane). Denote by $\vec{n}$ the unit normal vector to the cyan face of the pictured tetrahedron. Denote by $A_r$, $A_g$, $A_b$ and $A_c$ the areas of the red face, green face, blue face and cyan face, respectively. Then we have
\begin{equation*}
- A_r \vec{\imath} -A_g \vec{\jmath} - A_b \vec{k} + A_c \vec{n} = \vec{0}.
\end{equation*}
Consequently,
\begin{equation*}
A_c \vec{n} = A_r \vec{\imath} + A_g \vec{\jmath} + A_b \vec{k} = \bigl\langle A_r, A_g, A_b \bigr\rangle.
\end{equation*}
Our goal is to provide an estimate for the circulation of a smooth vector field \begin{equation*} \vec{F}(x,y,z) = \bigl\langle F_1(x,y,z), F_2(x,y,z), F_3(x,y,z) \bigr\rangle \end{equation*} along the cyan oriented triangle in the picture below. The cyan triangle is in the plane which is orthogonal to the unit vector $\vec{n}$ and it encloses the area of the cyan triangle in the picture above. We will use this estimate to obtain a formula for the circulation per unit area of the vector field $\vec{F}$ at the cyan point $P_c$, which is a fixed point in the plane of $T_c$ as in the picture below. This circulation density is denoted by \begin{equation*} (\operatorname{circ}_{\vec{n}} \vec{F}) (P_c). \end{equation*}
Denote by $T_r$, $T_g$, $T_b$ and $T_c$ the red, green, blue and cyan oriented triangle in the picture below. Looking carefully at the picture below we deduce that \begin{equation*} \oint_{T_c} \vec{F} \cdot d\vec{r} = \oint_{T_r} \vec{F} \cdot d\vec{r} + \oint_{T_g} \vec{F} \cdot d\vec{r} + \oint_{T_b} \vec{F} \cdot d\vec{r}. \end{equation*} Recall: the triangle $T_r$ is parallel to $yz$-plane and it encloses the area $A_r$, the triangle $T_g$ is parallel to $zx$-plane and it encloses the area $A_g$, the triangle $T_b$ is parallel to $xy$-plane and it encloses the area $A_b$ (the areas seen in the picture above).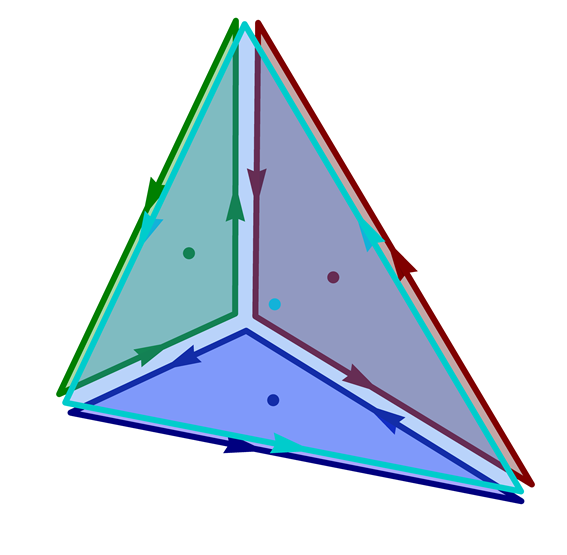 In the above picture we emphasized four points. Denote the red point which is in plane of the triangle $T_r$ by $P_r$, denote the green point which is in plane of the triangle $T_g$ by $P_g$, denote the blue point which is in plane of the triangle $T_b$ by $P_b$ and denote the cyan point which is in plane of the triangle $T_c$ by $P_c$.
Applying Green's theorem to triangles $T_r$, $T_g$ and $T_b$ we get the following three estimates: \begin{equation*} \oint_{T_r} \vec{F} \cdot d\vec{r} \approx \Bigl( \frac{\partial F_3}{\partial y}(P_r) - \frac{\partial F_2}{\partial z}(P_r) \Bigr) \, A_r, \end{equation*} \begin{equation*} \oint_{T_g} \vec{F} \cdot d\vec{r} \approx \Bigl( \frac{\partial F_1}{\partial z}(P_g) - \frac{\partial F_3}{\partial x}(P_g) \Bigr) \, A_g, \end{equation*} \begin{equation*} \oint_{T_b} \vec{F} \cdot d\vec{r} \approx \Bigl( \frac{\partial F_2}{\partial x}(P_b) - \frac{\partial F_1}{\partial y}(P_b) \Bigr) \, A_b. \end{equation*} Since \begin{equation*} \oint_{T_c} \vec{F} \cdot d\vec{r} = \oint_{T_r} \vec{F} \cdot d\vec{r} + \oint_{T_g} \vec{F} \cdot d\vec{r} + \oint_{T_b} \vec{F} \cdot d\vec{r}, \end{equation*} we have the estimate \begin{equation*} \oint_{T_c} \vec{F} \cdot d\vec{r} \approx \Biggl\langle \frac{\partial F_3}{\partial y}(P_r) - \frac{\partial F_2}{\partial z}(P_r), \frac{\partial F_1}{\partial z}(P_g) - \frac{\partial F_3}{\partial x}(P_g), \frac{\partial F_2}{\partial x}(P_b) - \frac{\partial F_1}{\partial y}(P_b) \Biggr\rangle \cdot \bigl\langle A_r, A_g, A_b \bigr\rangle. \end{equation*} Since \begin{equation*} A_c \vec{n} = \bigl\langle A_r, A_g, A_b \bigr\rangle. \end{equation*} we have \begin{equation*} \frac{1}{A_c} \oint_{T_c} \vec{F} \cdot d\vec{r} \approx \Biggl\langle \frac{\partial F_3}{\partial y}(P_r) - \frac{\partial F_2}{\partial z}(P_r), \frac{\partial F_1}{\partial z}(P_g) - \frac{\partial F_3}{\partial x}(P_g), \frac{\partial F_2}{\partial x}(P_b) - \frac{\partial F_1}{\partial y}(P_b) \Biggr\rangle \cdot \vec{n}. \end{equation*} As triangle $T_c$ collapses to the point $P_c$ the left hand side of the above equation converges to $(\operatorname{circ}_{\vec{n}} \vec{F}) (P_c)$, while the right hand side converges to \begin{equation*} \Biggl\langle \frac{\partial F_3}{\partial y}(P_c) - \frac{\partial F_2}{\partial z}(P_c), \frac{\partial F_1}{\partial z}(P_c) - \frac{\partial F_3}{\partial x}(P_c), \frac{\partial F_2}{\partial x}(P_c) - \frac{\partial F_1}{\partial y}(P_c) \Biggr\rangle \cdot \vec{n}. \end{equation*} Therefore \begin{equation*} (\operatorname{circ}_{\vec{n}} \vec{F}) (P_c) = \Biggl\langle \frac{\partial F_3}{\partial y}(P_c) - \frac{\partial F_2}{\partial z}(P_c), \frac{\partial F_1}{\partial z}(P_c) - \frac{\partial F_3}{\partial x}(P_c), \frac{\partial F_2}{\partial x}(P_c) - \frac{\partial F_1}{\partial y}(P_c) \Biggr\rangle \cdot \vec{n}. \end{equation*} From the above formula it is clear that the circulation density $(\operatorname{circ}_{\vec{n}} \vec{F}) (P_c)$ is the largest in the direction of the vector \begin{equation*} \Biggl\langle \frac{\partial F_3}{\partial y}(P_c) - \frac{\partial F_2}{\partial z}(P_c), \frac{\partial F_1}{\partial z}(P_c) - \frac{\partial F_3}{\partial x}(P_c), \frac{\partial F_2}{\partial x}(P_c) - \frac{\partial F_1}{\partial y}(P_c) \Biggr\rangle. \end{equation*} This vector is called the curl of $\vec{F}$ at the point $P_c$. A useful mnemonic tool is to introduce the nabla operator (see its Wikipedia page) \begin{equation*} \nabla = \Biggl\langle \frac{\partial }{\partial x},\frac{\partial }{\partial y},\frac{\partial }{\partial z} \Biggr\rangle. \end{equation*} With the nabla notation we have \begin{equation*} \operatorname{curl} \vec{F} = \nabla \times \vec{F} = \left| \begin{array}{ccc} \vec{\imath} & \vec{\jmath} & \vec{k} \\ \frac{\partial }{\partial x} & \frac{\partial }{\partial y} & \frac{\partial }{\partial z} \\ F_1 & F_2 & F_3 \end{array} \right|. \end{equation*} To emphasize that the nabla plays a role of a vector, in class I like adding an arrow over nabla: $\vec{\nabla}$.
- For Section 19.4 do these problems 3, 7, 9, 11, 15, 16, 17, 19, 20, 23, 25, 26, 27, 28, 29, 30, 31.
- For Section 19.3 do these problems 1, 3, 5, 6, 7, 11, 13, 17, 19, 21, 24, 27, 29, 35, 36, 37, 38.
- For Section 19.2 do these problems 7, 10, 11, 14, 17, 25, 26, 29, 31, 38, 39, 41, 43, 45, 46, 47, 48, 51, 53, 55, 59, 61, 63.
- For Section 19.1 do these problems 1, 2, 3, 7, 10, 11, 12, 14, 15, 17, 24, 20, 25, 26, 28, 30, 31, 33, 34, 39, 41, 46, 53, 56, 61, 58, 63, 64, 67, 69, 70.
- We did Problem 33 in Section 18.4 today. This problem deals with the Folium of Decartes curve. As pointed out in the book this curve is given by implicit equation \[ x^3+y^3 - 3 x y =0. \] The vector equation for this curve is \[ \left\langle \frac{3t}{1+t^3}, \frac{3t^2}{1+t^3} \right\rangle, \qquad t \in (-\infty,-1) \cup (-1,+\infty) = \mathbb{R}\setminus\{-1\}. \]
-
I will explain one way to understand the graph of the Folium of Decartes without using the technology. We first figure out the intersections of the Folium of Decartes with the lines $y = c - x.$ So, substitute $y = c -x$ in the implicit equation $x^3+y^3 - 3 x y =0.$ The resulting equation is a quadratic equation in $x$ with $c$ as a parameter. The following interesting trichotomy holds:
- For $c = 0$ and $c = 3$ we have a unique solution for $x.$ So we found that the points $(0,0)$ and $(3/2,3/2)$ are on the curve. These are the black and the red point on the picture below.
- For $c \in (-1,0) \cup (0,3)$ we have two distinct solutions for $x.$ These solutions result in two points on the curve which are symmetric with respect to the line $y=x$ and lie on the line $y=c-x$ symmetric with respect to the point $(c/2,c/2).$ A pair of such points are the points $\bigl(2^{2/3},2^{2/3}\bigr)$ and $\bigl(2^{2/3},2^{2/3}\bigr).$ The first of these points is maroon and the second is light red on the picture below. For a positive $c$ the corresponding points lie in the first quadrant, one above, the other below the diagonal. For negative $c$ one of the points lies in the second and the symmetric one in the fourth quadrant.
- For $c \in (-\infty,-1]\cup (3, + \infty)$ there are no solutions for $x.$ That is, for such $c$-s the lines $y=c-x$ do not intersect the given curve. The significance of the line $y = -1 - x$ is that it is an asymptote for the Folium of Decartes.
-
With the above analysis of the Folium of Decartes we understand the plot below better.
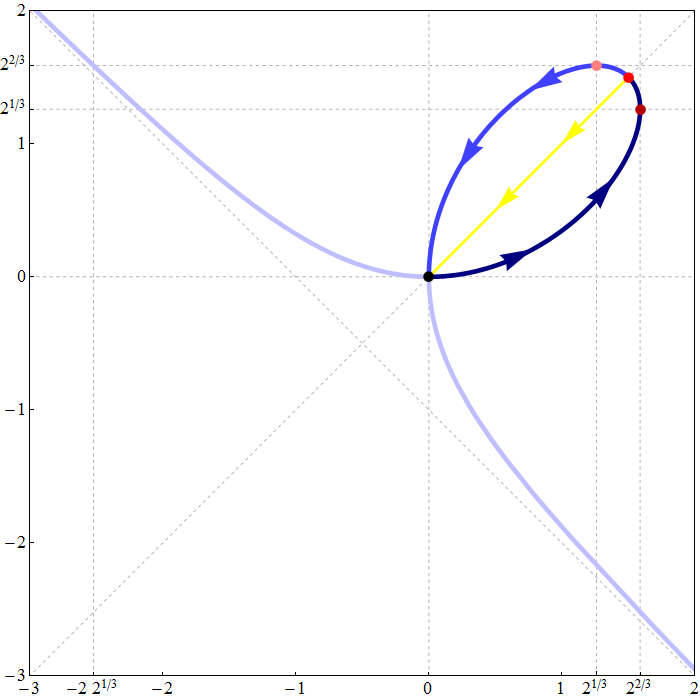 On the plot above I emphasised the part of the curve corresponding to $t \in (0,1)$ in dark blue. That is the part between the black point and the red point which is below the diagonal and contains the maroon point. The part between the red and black point which is above the diagonal is in blue. This part contains the light red point. On the curve I indicated the direction of the increasing $t$ by arrows.
- The textbook asks to calculate the area in the first quadrant enclosed by this curve. The part of the curve in the first quadrant corresponds to the parameter $t \in [0,+\infty).$ To calculate the area we need to evaluate the following line integral \begin{align*} \oint_C x \boldsymbol{j} \cdot d\boldsymbol{r} & = \int_0^{\infty} \left\langle 0, \frac{3t}{1+t^3} \right\rangle \cdot \left\langle \frac{3-6 t^3}{\left(t^3+1\right)^2}, \frac{3 t \left(2 - t^3\right)}{\left(t^3+1\right)^2} \right\rangle dt \\ & = \int_0^{\infty} \frac{9 t^2 \left(2 - t^3 \right)}{\left(t^3+1\right)^3} dt \\ & = \int_0^{\infty} \frac{18 t^2 }{\left(t^3+1\right)^3} dt - \int_0^{\infty} \frac{9t^5}{\left(t^3+1\right)^3} dt \\ & = \int_1^{\infty} \frac{6}{u^3} du - \int_1^{\infty} \frac{3(u-1)}{u^3} du \\ & = 9 \int_1^{\infty} \frac{1}{u^3} du - 3 \int_1^{\infty} \frac{1}{u^2} du \\ & = -\frac{9}{2} \left. \frac{1}{u^2} \right|_1^{\infty} + 3 \left. \frac{1}{u} \right|_1^{\infty} \\ & = \frac{9}{2} - 3 \\ &= \frac{3}{2} \end{align*}
- In the above calculation we encountered in improper integral and one is justified in being a little suspicions about the validity of that method. Luckily, in this problem we can avoid the improper integral by calculating one-half of the asked area which is below the diagonal. To accomplish this we need to calculate the line integral of the same vector field along the yellow oriented line in the picture above. This line integral equals \[ \int_0^{3/2} \left\langle 0, \frac{3}{2} - s \right\rangle \cdot \left\langle -1,-1 \right\rangle ds = \int_0^{3/2} \left( s - \frac{3}{2} \right) ds = -\frac{9}{8} \] Now we calculate the line integral along the dark blue part of the curve. The parameter $t \in [0,1]$ in this case. \begin{align*} \int_{C_b} x \boldsymbol{j} \cdot d\boldsymbol{r} & = \int_0^{1} \left\langle 0, \frac{3t}{1+t^3} \right\rangle \cdot \left\langle \frac{3-6 t^3}{\left(t^3+1\right)^2}, \frac{3 t \left(2 - t^3\right)}{\left(t^3+1\right)^2} \right\rangle dt \\ & = \int_0^{1} \frac{18 t^2 }{\left(t^3+1\right)^3} dt - \int_0^{1} \frac{9t^5}{\left(t^3+1\right)^3} dt \\ & = \int_1^{2} \frac{6}{u^3} du - \int_1^{2} \frac{3(u-1)}{u^3} du \\ & = -\frac{9}{2} \left. \frac{1}{u^2} \right|_1^{2} + 3 \left. \frac{1}{u} \right|_1^{2} \\ & = - \frac{9}{8} + \frac{9}{2} + \frac{3}{2} - 3 \\ &= \frac{15}{8} \end{align*} Thus, the area is $2(15/8 - 9/8) = 3/2.$
-
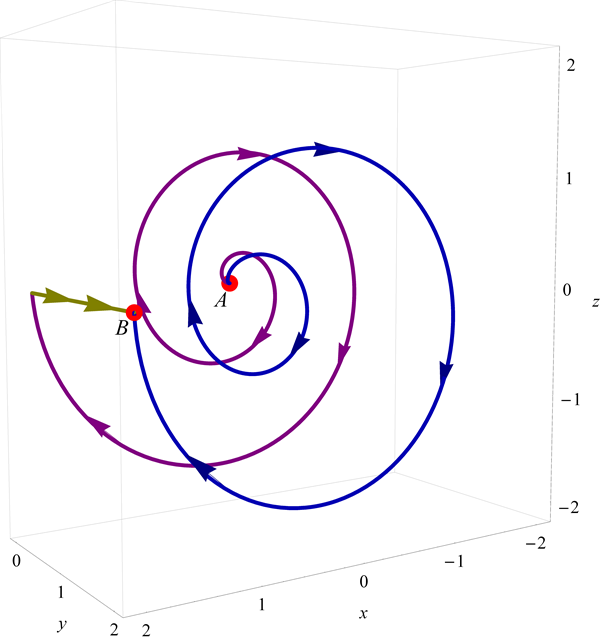
We also did Problem 29 in Section 18.4. Two oriented curves are given in this problem. In the plot below the given curve $C_1$ is the purple curve and the given curve $C_2$ is the navy blue curve.
 In part (b) of this problem we are asked to calculate the line integral of the vector field
\begin{equation*}
\vec{F} = \bigl\langle yz, z x + z, xy+y+1 \bigr\rangle
\end{equation*}
along the navy blue curve. It turns out that calculating this line integral is difficult. To simplify the calculation we observe that the curl of the vector field $\vec{F}$ is $\vec{0}.$ Since the vector field $\vec{F}$ is everywhere defined the curl test tells us that $\vec{F}$ is a gradient field. Therefore $\vec{F}$ is path-independent. Consequently, the line integral along the navy blue curve equals the sum of the line integral along the purple curve plus the line integral along the olive curve. Both of these integrals are easy. The line integral along the purple curve is
\begin{align*}
\int_0^2 \bigl\langle 0, & t^2 (\cos 2 \pi t) (\sin 2\pi t) + t (\sin 2\pi t), 1 \bigr\rangle \\
& \cdot \bigl\langle (\cos 2 \pi t) - 2 \pi t (\sin 2 \pi t) , 0, (\sin 2\pi t) + 2 \pi t (\cos 2\pi t) \bigr\rangle dt \\
& = \int_0^2 \bigl( (\sin 2\pi t) + 2 \pi t (\cos 2\pi t) \bigr) dt \\
& = \Bigl( t (\sin 2\pi t) \Bigr) \Bigl. \Bigr|_0^2 \\
& = 0.
\end{align*}
The line integral along the olive curve is
\[
\int_0^2 \bigl\langle 0, 0, 2 t + t + 1 \bigr\rangle \cdot \bigl\langle 0,1,0 \bigr\rangle dt = \int_0^2 0 dt = 0.
\]
In part (b) of this problem we are asked to calculate the line integral of the vector field
\begin{equation*}
\vec{F} = \bigl\langle yz, z x + z, xy+y+1 \bigr\rangle
\end{equation*}
along the navy blue curve. It turns out that calculating this line integral is difficult. To simplify the calculation we observe that the curl of the vector field $\vec{F}$ is $\vec{0}.$ Since the vector field $\vec{F}$ is everywhere defined the curl test tells us that $\vec{F}$ is a gradient field. Therefore $\vec{F}$ is path-independent. Consequently, the line integral along the navy blue curve equals the sum of the line integral along the purple curve plus the line integral along the olive curve. Both of these integrals are easy. The line integral along the purple curve is
\begin{align*}
\int_0^2 \bigl\langle 0, & t^2 (\cos 2 \pi t) (\sin 2\pi t) + t (\sin 2\pi t), 1 \bigr\rangle \\
& \cdot \bigl\langle (\cos 2 \pi t) - 2 \pi t (\sin 2 \pi t) , 0, (\sin 2\pi t) + 2 \pi t (\cos 2\pi t) \bigr\rangle dt \\
& = \int_0^2 \bigl( (\sin 2\pi t) + 2 \pi t (\cos 2\pi t) \bigr) dt \\
& = \Bigl( t (\sin 2\pi t) \Bigr) \Bigl. \Bigr|_0^2 \\
& = 0.
\end{align*}
The line integral along the olive curve is
\[
\int_0^2 \bigl\langle 0, 0, 2 t + t + 1 \bigr\rangle \cdot \bigl\langle 0,1,0 \bigr\rangle dt = \int_0^2 0 dt = 0.
\]
Another way to calculate the requested line integral is to observe that \begin{equation*} \vec{F} = \bigl\langle yz, z x + z, xy+y+1 \bigr\rangle = \operatorname{grad} \bigl( xyz + yz + z \bigr) \end{equation*} and calculate the value of $f(x,y,z) = xyz + yz + z$ at the red point $A = (0,0,0)$ and the red point $B = (2,2,0)$. Then the requested line integral equals $f(B) - f(A) = 0.$ - Today in class I created this Mathematica file. In this file I illustrated how to do the first of the above problems in Mathematica_8.
- For Section 18.4 do these problems 1, 2, 5, 7, 8, 10, 12, 13, 15, 17, 19, 21, 26, 29, 30, 31, 32, 33, 34, 37, 38, 39, 41, 42.
-
Section 18.4 is a very interesting section. In class I pointed out that whether a vector field is a gradient field or not might depend on its domain. For example, the vector field
\[
\boldsymbol{F}(x,y) = -\frac{y}{x^2+y^2} \boldsymbol{i} + \frac{x}{x^2+y^2} \boldsymbol{j}
\]
is not a gradient field over its domain
\[
D_p = \bigl\{(x,y) \in {\mathbb R}^2 : x^2 + y^2 \neq 0 \bigr\} = {\mathbb R}^2 \setminus \bigl\{(0,0)\bigr\}.
\]
Notice that $D_p$ is a punctured plane: the $xy$-plane from which the origin has been removed. To see that $\boldsymbol{F}$ is not a gradient field over this $D_p$, just calculate the circulation of $\boldsymbol{F}$ along the unit circle.
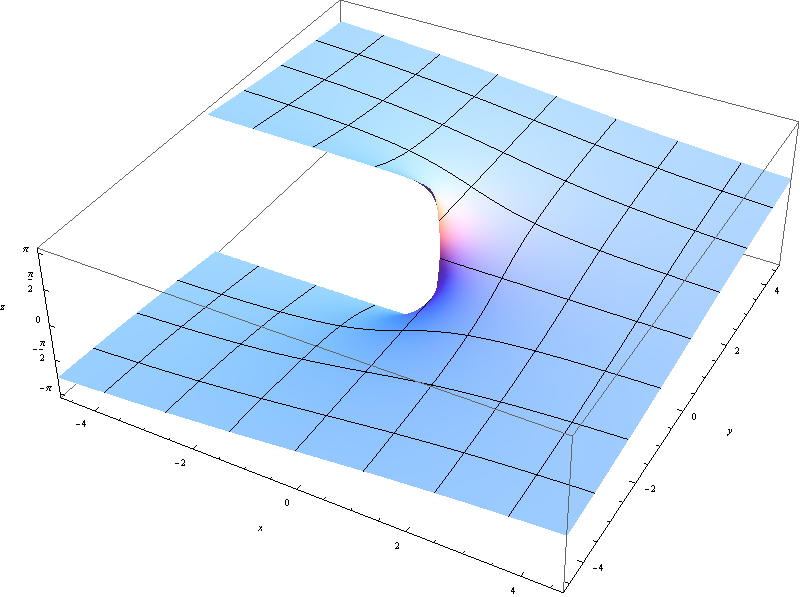
However, if we restrict the domain of $\boldsymbol{F}$ to the cut plane defined as \[ D_c = \bigl\{(x,y) \in {\mathbb R}^2 : y \neq 0 \ \text{or} \ x \gt 0 \bigr\} = {\mathbb R}^2 \setminus \bigl\{(x,0) \in {\mathbb R}^2 \bigl| x \leq 0 \bigr. \bigr\} , \] then the vector field $\boldsymbol{F}$ is a gradient field. In fact, $\boldsymbol{F}$ is the gradient of the function \[ f(x,y) = \begin{cases} -\arctan(x/y) + \pi/2 & \quad \text{if} \quad y \gt 0, \\ \phantom{-}0 & \quad \text{if} \quad y = 0 \quad \text{and} \quad x \gt 0 , \\ -\arctan(x/y) - \pi/2 & \quad \text{if} \quad y \lt 0. \end{cases} \] Notice that the domain of the function $f$ is exactly the set $D_c.$ Also, notice that $D_c$ is the $xy$-plane from which the origin and the negative $x$-half-axis have been removed. -
The formula for $f(x,y)$ above looks complicated but this is not too complicated function. Here is its plot.
- For Section 18.3 do these problems 1, 3, 4, 5, 7, 8, 9, 13, 15, 17, 19, 20, 23, 26, 28, 29, 31, 33, 34, 37, 49, 53, 54, 57.
-
Since we are working with vectors in this class, and I am using colors to clarify relationship between various mathematical quantities that we encounter, I will present how colors can be organized using vectors in the unit cube.
- All colors are identified in Mathematica by a vector $\displaystyle \begin{bmatrix}x \\ y \\ z\end{bmatrix}$ with $0 \leq x \leq 1$, $0 \leq y \leq 1$, $0 \leq z \leq 1$. In other words, Mathematica identifies colors with the points in the unit cube in the $xyz$-space. In this setting the unit cube is called The Color Cube.
- Below is an image of the color cube with 27 colors emphasized.
- Some of the colors emphasized below have common names. For others I tried to find appropriate names.
- Here I adopt following mathematical definitions of dark and light adjectives for colors: For a specific COLOR we define the dark COLOR to be the color which is half-way between COLOR and BLACK, that is the vector corresponding to the COLOR scaled by $1/2$. For a specific COLOR we define the light COLOR to be the color which is half-way between COLOR and WHITE, that is the sum of the vector $(1/2,1/2,1/2)$ and the vector corresponding to the COLOR scaled by $1/2$.
-
In this terminology maroon is just dark red, navy is dark blue, teal is dark cyan, purple is dark magenta, olive is dark yellow, gray is light black, or gray is dark white, salmon is light red, ultra pink is light magenta.
$\displaystyle \begin{bmatrix}0 \\ 0 \\0\end{bmatrix}$ Black $\displaystyle \begin{bmatrix}1/2 \\ 1/2 \\ 1/2\end{bmatrix}$ Gray $\displaystyle \begin{bmatrix}1 \\ 1 \\ 1\end{bmatrix}$ White $\displaystyle \begin{bmatrix}1 \\ 0 \\0\end{bmatrix}$ Red $\displaystyle \begin{bmatrix}1/2 \\ 0 \\0\end{bmatrix}$ Maroon $\displaystyle \begin{bmatrix}1/2 \\ 1/2 \\0\end{bmatrix}$ Olive $\displaystyle \begin{bmatrix}1 \\ 1/2 \\0\end{bmatrix}$ Orange $\displaystyle \begin{bmatrix}1 \\ 1 \\0\end{bmatrix}$ Yellow $\displaystyle \begin{bmatrix}0 \\ 1 \\0\end{bmatrix}$ Green $\displaystyle \begin{bmatrix}0 \\ 1/2 \\0\end{bmatrix}$ Dark Green $\displaystyle \begin{bmatrix}1/2 \\ 1 \\0\end{bmatrix}$ Chartruse $\displaystyle \begin{bmatrix}0 \\ 1/2 \\ 1/2\end{bmatrix}$ Teal $\displaystyle \begin{bmatrix}0 \\ 1 \\1/2\end{bmatrix}$ Spring Green $\displaystyle \begin{bmatrix}0 \\ 0 \\1\end{bmatrix}$ Blue $\displaystyle \begin{bmatrix}0 \\ 0 \\ 1/2\end{bmatrix}$ Navy $\displaystyle \begin{bmatrix}1/2 \\ 0 \\ 1/2\end{bmatrix}$ Purple $\displaystyle \begin{bmatrix}1 \\ 0 \\ 1\end{bmatrix}$ Magenta $\displaystyle \begin{bmatrix}0 \\ 1 \\ 1\end{bmatrix}$ Cyan $\displaystyle \begin{bmatrix}1/2 \\ 0 \\ 1\end{bmatrix}$ Dark Violet $\displaystyle \begin{bmatrix}0 \\ 1/2 \\1\end{bmatrix}$ Sky Blue $\displaystyle \begin{bmatrix}1/2 \\ 1/2 \\ 1\end{bmatrix}$ Light Blue $\displaystyle \begin{bmatrix} 1 \\ 1/2 \\1\end{bmatrix}$ Ultra Pink $\displaystyle \begin{bmatrix} 1/2 \\ 1 \\1 \end{bmatrix}$ Light Cyan $\displaystyle \begin{bmatrix}1 \\ 0 \\ 1/2 \end{bmatrix}$ Magenta Red $\displaystyle \begin{bmatrix} 1 \\ 1/2 \\ 1/2 \end{bmatrix}$ Salmon $\displaystyle \begin{bmatrix}1 \\ 1 \\ 1/2 \end{bmatrix}$ Light Yellow $\displaystyle \begin{bmatrix}1/2 \\ 1 \\ 1/2 \end{bmatrix}$ Light Green Place the cursor over the image to start the animation.
-
Thinking of colors as vectors helps us to understand a transition between two colors. Below I show three ways of interpreting a transition between
Teal and Yellow.
Place the cursor over the image to start the animation.
Since Teal and Yellow are the heads of particular vectors in the Color Cube, to construct a transition I connected the heads with a line segment. Points on this line segment are the heads of special linear combinations of the vectors representing Teal and Yellow. As an exercise write the linear combinations which are used in the above transition.
Place the cursor over the image to start the animation.
In the above animation I used the colors from the line segment connecting Teal and Yellow to color the rectangles in the middle of the square.
Above is the unit circle colored using colors from the line segment connecting Teal and Yellow.
- For Section 18.2 do these problems 1-3, 5, 7, 8, 13, 14, 17, 19, 20, 21, 22, 23, 24, 26, 28, 30, 31, 32, 35, 36, 38, 39, 41.
- For Section 18.1 do these problems 1-6, 7, 9, 13, 14, 15, 17, 19, 21, 22, 25, 27, 28-31, 32, 33, 35, 42-46, 47, 49, 51, 55, 56, 57, 58.
- In class I demonstrated this Mathematica file. The file is called VectorFields_v8.nb. Right-click on the underlined link; in the pop-up menu that appears, your browser will offer you to save the file in your directory. Make sure that you save it with the exactly same name. After saving the file you can open it with Mathematica 8.
- For Section 17.3 do these problems 1-6, 7, 10, 12, 13, 15, 17, 21, 22, 24, 25, 27, 28, 29, 30, 31, 32-34, 38, 39.
- For Section 17.4 do these problems 1, 3, 4-9, 16, 19, 20, 23, 24. In this section pay special attention to Examples 1, 2 and 3.
- In class I did a problem similar to Example 2: Find the parametric equations $\bigl(x(t),y(t)\bigr)$ of the flow line of the vector field $\boldsymbol{F}(x,y) = y \boldsymbol{i} + \boldsymbol{j}$ such that $\bigl(x(0),y(0)\bigr) = (0,-2).$ Also find the implicit equation of this flow line.
- Do this problem: Find the parametric equations $\bigl(x(t),y(t)\bigr)$ of the flow line of the vector field $\boldsymbol{F}(x,y) = \boldsymbol{i} + y \boldsymbol{j}$ such that $\bigl(x(0),y(0)\bigr) = (0,-2).$ Also find the implicit equation of this flow line.
-
In the problems below I use the following notation. The unit disk in $\mathbb{R}^2$ is denoted by $\mathbb{D}$. That is
\[
\mathbb{D} = \bigl\{ (x,y) \in \mathbb{R}^2 | x^2 + y^2 \leq 1 \bigr\}.
\]
The special square in $\mathbb{R}^2$ whose edges are tangent to $ \mathbb{D}$ and parallel to the coordinate axes is denoted by $\mathbb{Q}$. That is,
\[
\mathbb{Q} = \bigl\{ (x,y) \in \mathbb{R}^2 | x,y \in [-1,1] \bigr\}.
\]
The unit ball in $\mathbb{R}^3$ is denoted by $\mathbb{B}$. That is
\[
\mathbb{B} = \bigl\{ (x,y,z) \in \mathbb{R}^3 | x^2 + y^2 + z^2 \leq 1 \bigr\}.
\]
The special cube in $\mathbb{R}^3$ whose sides are tangent to $\mathbb{B}$ and parallel to the coordinate planes is denoted by $\mathbb{U}$. That is,
\[
\mathbb{U} = \bigl\{ (x,y,z) \in \mathbb{R}^2 | x,y,z \in [-1,1] \bigr\}.
\]
- Problem 1. Find the average distance of a point in $\mathbb{D}$ to the center $(0,0)$ of $\mathbb{D}.$
- Problem 2. Find the average distance of a point in $\mathbb{D}$ to a fixed diameter of $\mathbb{D}.$ Here you can choose a diameter along the $x$-axis or along the $y$-axis.
- Problem 3. Find the average distance of a point in $\mathbb{D}$ to the coordinate axes. Recall that the distance of a point $(x,y)$ to the coordinate axes is given by $\min\{|x|,|y|\}.$
- Problem 4. Find the average distance of a point in $\mathbb{Q}$ to the $x$-axis.
- Problem 5. Find the average distance of a point in $\mathbb{Q}$ to a fixed diagonal of $\mathbb{Q}.$ Here you can choose the diagonal joining the points $(-1,-1)$ and $(1,1).$
- Problem 6. Find the average distance of a point in $\mathbb{Q}$ to the coordinate axes.
- Problem 7. Find the average distance of a point in $\mathbb{B}$ to the center $(0,0,0)$ of $\mathbb{B}.$
- Problem 8. Find the average distance of a point in $\mathbb{B}$ to a fixed diameter of $\mathbb{B}.$ Here you can chose the diameter along the $z$-axis.
- Problem 9. Find the average distance of a point in $\mathbb{B}$ to $xy$-plane.
- Problem 10. Find the average distance of a point in $\mathbb{B}$ to the coordinate planes. Recall that the distance of a point $(x,y,z)$ to the coordinate planes is given by $\min\{|x|,|y|,|z|\}.$ (This is the hardest problem on this list.)
- Problem 11. Find the average distance of a point in $\mathbb{U}$ to $xy$-plane.
- Problem 12. Find the average distance of a point in $\mathbb{U}$ to the coordinate planes.
-
Below I list few problems in which arc length of a curve can be calculated explicitly.
- Problem 1. Calculate the arc length of the graph of the function $y = x^{3/2}$ between the points $(0,0)$ and $(1,1)$.
- Problem 2. Calculate the arc length of the graph of the function $y= (1/4) x^2-(1/2) \ln x$, between the points $(1,1/4)$ and $\bigl(e,(e^2-2)/4\bigr)$.
- Problem 3. Calculate the arc length of the cycloid given by the parametric equations \[ x(t) = t- \sin t , \quad y(t) = 1-\cos t \quad \text{where} \quad 0 \leq t \leq 2 \pi. \]
- Problem 4. Calculate the arc length of the astroid curve given by the parametric equations \[ x(t) = (\cos t)^3, \quad y(t) = (\sin t)^3 \quad \text{where} \quad 0 \leq t \leq 2 \pi. \]
- Problem 5. Calculate the arc length of the spiral given by the parametric equations \[ x(t) = (\exp t)(\cos t), \quad y(t) = (\exp t)(\sin t) \quad \text{where} \quad -\pi \leq t \leq \pi. \]
- Problem 6. Calculate the arc length of the cardioid given by the parametric equations \[ x(t) = (1+\cos t)\cos t, \quad y(t) = (1+\cos t) \sin t \quad \text{where} \quad 0 \leq t \leq 2\pi. \]
-
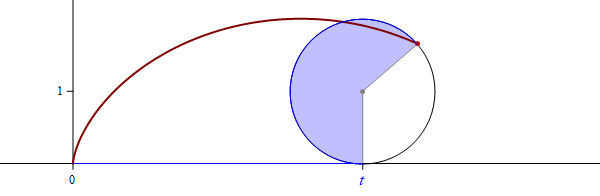
Here is a derivation of the equation of a cardioid.
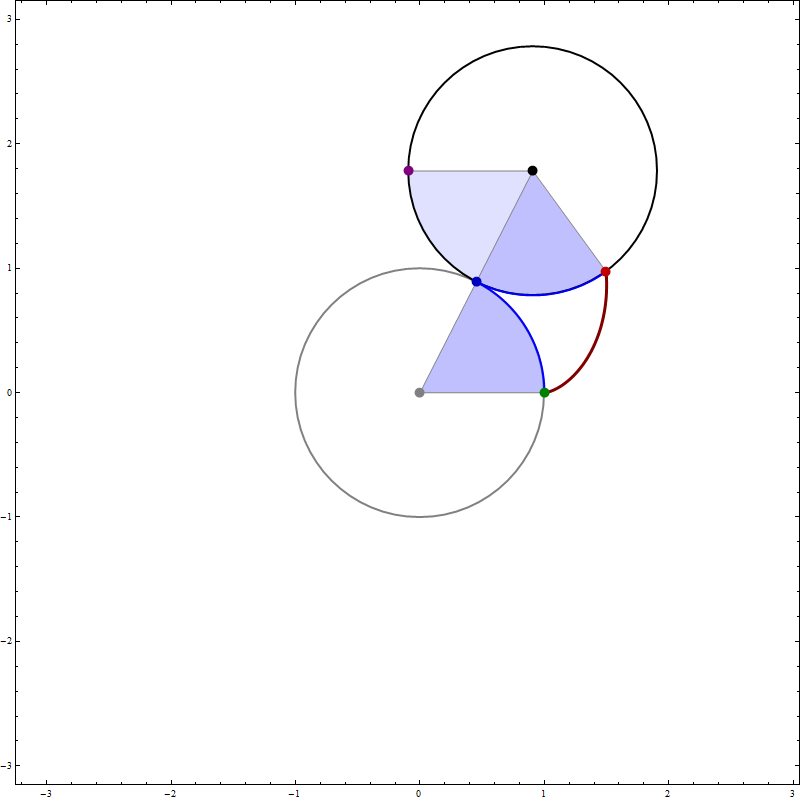
Click through several helpful images.
- The origin $O = (0,0)$ of the coordinate system is the gray point. Denote by $C$ the black point in the picture.
- Both circles in the picture are unit circles, the gray one centered at $O,$ the black one centered at $C.$
- The angle at the gray point marked by the blue arc between the green and the blue point measures $t$ radians. That is, the length of this blue arc is $t.$
- There are two other angles in the picture which also measure $t$ radians: the angle marked by the blue arc between the blue and the red point and the angle marked by the black arc between the blue point and the purple point.
- The green point is $(1,0),$ the blue point is $(\cos t, \sin t),$ the black point $C$ is $(2\cos t, 2\sin t),$ the purple point is $(2\cos t-1, 2\sin t).$
- The goal is to determine the coordinates of the red point.
- Denote by $\boldsymbol{a}$ the unit vector whose tail is the black point and whose head is the red point. Based on the previous items we have \begin{align*} \boldsymbol{a} & = \bigl(\cos( \pi+2 t ) \bigr) \boldsymbol{i} + \bigl(\sin( \pi+2 t ) \bigr) \boldsymbol{j} \\ & = -\bigl(\cos(2 t ) \bigr) \boldsymbol{i} - \bigl(\sin(2 t ) \bigr) \boldsymbol{j}. \end{align*}
- Denote by $\boldsymbol{c}$ the position vector of the black point. Then the position vector of the red point is \[ \boldsymbol{c} + \boldsymbol{a} = \bigl( 2 \cos t - \cos(2 t ) \bigr) \boldsymbol{i} + \bigl(2 \sin t - \sin(2 t ) \bigr) \boldsymbol{j}. \]
- Thus the parametric equations for this cardioid are \begin{align*} x = u(t) & = 2 \cos t - \cos(2 t ) \\ y = v(t) & = 2 \sin t - \sin(2 t ) \end{align*}
Place the cursor over the image to start the animation.
-
You will probably notice that what I call cardioid in Problem 6 differs from the cardioid that we derived in class. The parametric equations that we deduced for a cardioid in class were
\[
x = u_1(t) = 2 \cos(t) -\cos(2t), \quad y = v_1(t) = 2 \sin(t) -\sin(2t).
\]
The cardioid that we derived in class is the cardioid in Problem 6 scaled by two and translated to the point $(1,0)$. This is justified by the following calculations:
\begin{align*}
u_1(t) & = 2 \cos(t) -\cos(2t) \\
& = 2 \cos(t) -(\cos t)^2 +(\sin t)^2 - (\cos t)^2 - (\sin t)^2 + 1 \\
& = 2 \cos(t) - 2(\cos t)^2 + 1 \\
& = 2(1-\cos t) \cos t + 1 \\
& = 2 u(t) + 1, \\
v_1(t) & = 2 \sin(t) -\sin(2t) \\
& = 2 \sin(t) - 2 (\sin t) (\cos t)\\
& = 2(1-\cos t) \sin t \\
& = 2 v(t).
\end{align*}
Hence
\[
\bigl(u_1(t),v_1(t)\bigr) = 2\bigl(u(t),v(t)\bigr) + (1,0).
\]
Or, in pictures,
The cardioid from Problem 6
The cardioid from Problem 6 scaled by 2
The cardioid from Problem 6 scaled by 2 and translated.
- For Section 21.1 do these problems 1-4, 5-8, 9-12, 13, 15, 18, 19, 22, 23, 26, 27, 31, 32, 33, 34, 35, 36.
- For Section 17.2 do these problems 1, 3, 5, 7, 8, 10, 12, 13, 15, 15, 17, 19, 21, 22, 23, 27, 28, 29, 30, 32, 36, 37, 41, 42, 44.
- During the class today I created this Mathematica file. The file is called 20190416_Surfaces.nb. Right-click on the underlined link; in the pop-up menu that appears, your browser will offer you to save the file in your directory. Make sure that you save it with the exactly same name. After saving the file you can open it with Mathematica 8.
-
In class we derived the following parametric equations of the torus
\[
\begin{array}{rl}
x = u(s,t) \!\!& = (b + a \sin s) ( \cos t), \\
y = v(s,t) \!\!& = (b + a \sin s) ( \sin t), \\
z = w(s,t) \!\!& = a \cos s, \\
\text{where} & s, t \in [0,2 \pi].
\end{array}
\]
Here we assume that $a \lt b.$ This torus is obtained as a circle of radius $a$ rotates about $z$-axis with the radius $b.$
Whenever we encounter a parametric equations of a surface it is important to identify so called parameter curves. We obtain parameter curves for the torus by keeping one parameter constant.
Set $s=s_0,$ where $s_0 \in [0,2 \pi],$ in the above parametric equations of the torus. Then we obtain the curve \[ \begin{array}{rl} x = u(s_0,t) \!\!& = (b + a \sin s_0) ( \cos t), \\ y = v(s_0,t) \!\!& = (b + a \sin s_0) ( \sin t), \\ z = w(s_0,t) \!\!& = a \cos s_0, \\ \text{where} & t \in [0,2 \pi]. \end{array} \] This is the circle in the horizontal plane $z = a \cos s_0$ centered at the point $(0,0,a \cos s_0)$ with the radius $b + a \sin s_0.$ The four most distinguished circles of this kind are as follows: For $s_0 = 0$ we obtain the highest circle at $z = a$ whose radius is $b$; for $s_0 = \pi$ we obtain the lowest circle at $z = -a$ whose radius is also $b$; $s_0 = \pi/2$ we obtain the largest circle of this kind at $z = 0$ whose radius is $b+a$; $s_0 = 3\pi/2$ we obtain the smallest circle of this kind also in the plane $z = 0$ whose radius is $b-a$. The animation below shows 48 such circles colored purple.Place the cursor over the image to start the animation.
Now set $t=t_0,$ where $t_0 \in [0,2 \pi],$ in the above parametric equations of the torus. Then we obtain the curve \[ \begin{array}{rl} x = u(s,t_0) \!\!& = (b + a \sin s) ( \cos t_0), \\ y = v(s,t_0) \!\!& = (b + a \sin s) ( \sin t_0), \\ z = w(s,t_0) \!\!& = a \cos s, \\ \text{where} & s \in [0,2 \pi]. \end{array} \] It is easier to look at the vector equation of this curve: \[ (b + a \sin s) ( \cos t_0) \boldsymbol{i} + (b + a \sin s) ( \sin t_0)\boldsymbol{j} + (a \cos s) \boldsymbol{k} \] which after grouping the terms becomes \[ b\bigl( (\cos t_0) \boldsymbol{i} + (\sin t_0)\boldsymbol{j} \bigr) + a \Bigl( (\cos s) \boldsymbol{k} + (\sin s) \bigl( (\cos t_0) \boldsymbol{i} + (\sin t_0)\boldsymbol{j} \bigr) \Bigr). \] To understand this equation, first notice that \[ ( \cos t_0) \boldsymbol{i} + (\sin t_0)\boldsymbol{j} \] is a constant unit vector in $xy$-plane. Therefore \[ (\cos s) \boldsymbol{k} + (\sin s) \bigl( ( \cos t_0) \boldsymbol{i} + (\sin t_0)\boldsymbol{j} \bigr), \quad s \in [0,2\pi], \] is a unit circle centered at $(0,0,0)$ which is vertical to $xy$-plane. The special cases of this unit circle are when $t_0 = 0$ we have \[ (\cos s) \boldsymbol{k} + (\sin s) \boldsymbol{i}, \quad s \in [0,2\pi]; \] for $t_0 = \pi/2$ we have \[ (\cos s) \boldsymbol{k} + (\sin s) \boldsymbol{j}, \quad s \in [0,2\pi]; \] for $t_0 = \pi$ we have \[ (\cos s) \boldsymbol{k} - (\sin s) \boldsymbol{i}, \quad s \in [0,2\pi]; \] for $t_0 = 3\pi/2$ we have \[ (\cos s) \boldsymbol{k} - (\sin s) \boldsymbol{j}, \quad s \in [0,2\pi]. \] The next step is to observe that \[ a \Bigl( (\cos s) \boldsymbol{k} + (\sin s) \bigl( ( \cos t_0) \boldsymbol{i} + (\sin t_0)\boldsymbol{j} \bigr) \Bigr), \quad s \in [0,2\pi], \] is a circle of radius $a$ centered at $(0,0,0)$ and finally the vector $b\bigl( (\cos t_0) \boldsymbol{i} + (\sin t_0)\boldsymbol{j} \bigr)$ moves the center of this circle to the point $(\cos t_0,\sin t_0, 0)$. Thus \[ b\bigl( (\cos t_0) \boldsymbol{i} + (\sin t_0)\boldsymbol{j} \bigr) + a \Bigl( (\cos s) \boldsymbol{k} + (\sin s) \bigl( (\cos t_0) \boldsymbol{i} + (\sin t_0)\boldsymbol{j} \bigr) \Bigr). \] is the circle of radius $a$ centered at the point $(\cos t_0,\sin t_0, 0)$ and in the plane spanned by the vectors $\boldsymbol{k}$ and $ (\cos t_0) \boldsymbol{i} + (\sin t_0)\boldsymbol{j}.$ The animation below shows 48 such circles colored teal.Place the cursor over the image to start the animation.
In the animation below I show how a torus can be obtained from a sphere with radius $a.$ First we move all the meridians of the sphere away from the $z$-axis to the distance $b.$ Then we extend the meridians which are half-circles to full-circles with radius $a.$
Place the cursor over the image to start the animation.
- For Section 17.1 do these problems 1, 2, 4, 5, 6, 11, 12, 14, 17, 18, 19, 20, 21, 23, 26, 27, 30, 23, 35, 39, 40, 31, 42, 43-48, 52-62, 74, 76, 81, 84, 89, 95.
-
In this item I will illustrate the derivation of the parametric equations for the cycloid.
Place the cursor over the image to start the animation.
The following animation the moving circle is pictured as a bicycle wheel.Place the cursor over the image to start the animation.
- On Tuesday we reviewed double integrals in polar coordinates. The most important concept here is the area element in polar coordinates: $dA = r \, d\theta \, d r$.
-
The first step to understanding the spherical coordinates is the understanding of the unit vectors in $\mathbb{R}^3.$
- The importance of the trigonometric functions $\cos$ and $\sin$ is that each point on the unit circle in $\mathbb{R}^2$ can be expressed as $\bigl( \cos t, \sin t \bigr)$ with $t \in [0, 2\pi)$, or with $t\in (-\pi,\pi].$ This is the reason that trigonometric functions are also called circular functions.
- If we denote the coordinate unit vectors in $\mathbb{R}^2$ by $\boldsymbol{i}$ and $\boldsymbol{j},$ then each unit vector $\boldsymbol{u}$ in $\mathbb{R}^2$ can be expressed as \[ \boldsymbol{u} = (\cos \theta) \boldsymbol{i} + (\sin \theta) \boldsymbol{j}, \qquad \quad \theta \in [0,2 \pi). \]
-
Let now $\boldsymbol{v}$ be a unit vector in the three-dimensional space $\mathbb{R}^3.$ That is
\[
\boldsymbol{v} = v_1 \boldsymbol{i} + v_2 \boldsymbol{j} + v_3 \boldsymbol{k}.
\]
In the figure below the choice of colors is not random:
- $\boldsymbol{v}$ is the black vector;
- $\boldsymbol{i}$ is the red vector;
- $\boldsymbol{j}$ is the green vector;
- $\boldsymbol{k}$ is the blue vector;
- the yellow vector is the unit vector in the direction of the projection of $\boldsymbol{v}$ onto $xy$-plane. Say, as before, \[ \boldsymbol{u} = (\cos \theta) \boldsymbol{i} + (\sin \theta) \boldsymbol{j}, \qquad \quad \theta \in [0,2 \pi); \] The angle $\theta$ is also colored yellow.
- $\phi \in (0,\pi)$ is the gray angle between $\boldsymbol{v}$ and $\boldsymbol{k}$.
Click on the image to animate in $\theta$; double-click to animate in $\phi$.
- In conclusion, each unit vector $\boldsymbol{v}$ in three-dimensional space is uniquely determined by two angles: the angle $\phi \in [0,\pi]$ between $\boldsymbol{v}$ and $\boldsymbol{k}$ and the angle $\theta \in [0,2 \pi)$ which is the angle between the projection of $\boldsymbol{v}$ onto $xy$-plane and $\boldsymbol{i}$. Then \[ \boldsymbol{v} = (\sin \phi)(\cos \theta) \boldsymbol{i} + (\sin \phi)(\sin \theta) \boldsymbol{j} + (\cos \phi) \boldsymbol{k}. \]
-
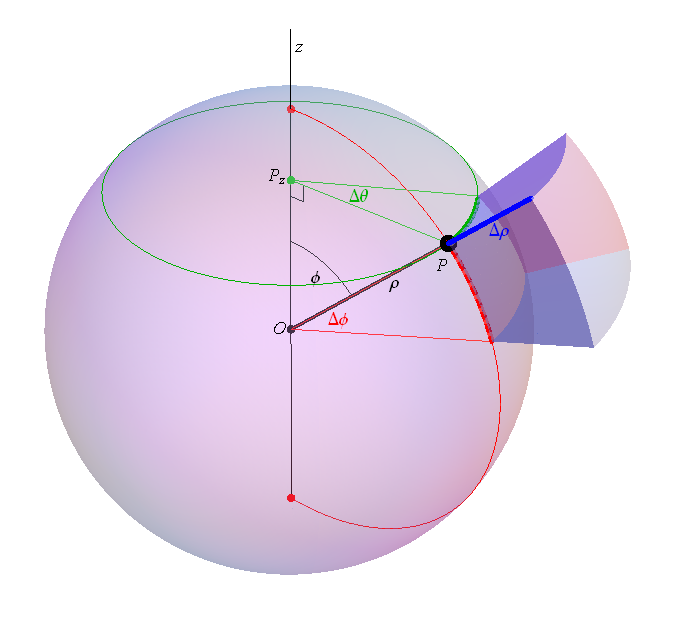
To enrich our toolbox for calculating triple integrals we need to understand cylindrical and spherical coordinates. The most important concepts here are the volume element in cylindrical coordinates: $dV = r \, d\theta \, d r \, dz$ and
the volume element in spherical coordinates is: $dV = \rho^2 (\sin \phi) \, d\theta\, d\phi \, d\rho$. I created the image below to help you understand this formula.
- There are several textbooks on the Library Reserve.
- Do these problems
- The assigned problems for 16.4 are 3, 4, 7, 8, 9, 10, 13, 15, 18, 21, 22, 22-26, 27, 28, 29, 30, 32, 33, 34, 36, 38, 39. (Do 38 in two different ways: calculating double integral in polar coordinates and using familiar formulas for areas related to a disk.)
- The assigned problems for 16.5 are 1-28 (do most), 29-34, 35, 36, 37, 38, 39, 42, 43, 44, 46, 47, 49, 52, 56. (In 35 the answer for (b) follows from a well known formula. The formulas for 46 and 47 should be familiar from high-school or Math~125. However, it is nice to confirm these formulas using triple integrals.)
-
During the class on Friday I created
this Mathematica file. The file is called 20190405.nb. Right-click on the underlined link; in the pop-up menu that appears, your browser will offer you to save the file in your directory. Make sure that you save it with the exactly same name. After saving the file you can open it with Mathematica 8. You will find Mathematica 8 on computers in BH 215 and in the Math Center. Look in
Start -> Wolfram Mathematica -> Mathematica 8. Open Mathematica first, then open 20190405.nb from Mathematica. -
When you open the file 20190405.nb you can go through the notebook cell by cell and evaluate each cell individually, or you can evaluate the entire notebook by the keyboard sequence
Alt+v o or with the manu item Evaluate ⇾ Evaluate Notebook.
Since in this file I am using the very powerful but slow command RegionPlot3D[] some cells will take a while to evaluate. Be patient. - More information on how to use Mathematica version 8 you can find on my Mathematica 8 page.
- The information sheet
- We will start by reviewing Chapter 16 (7th edition). Do these problems
- The assigned problems for 16.1 are 1, 3, 7, 8-14, 15.
- The assigned problems for 16.2 are 1-33 (do most), 35, 36, 37, 38, 43, 44, 45, 51, 54, 55, 57, 61, 71, 72, 74, 75.
- The assigned problems for 16.3 are 1-8, 11, 12, 14, 15, 16-29, 32, 33, 34, 35, 36, 38, 44, 45, 46, 49, 52, 56, 57, 65-67, 68-71.
- As we indicated today we will be using Mathematica in this class. We will be using Mathematica 8 which is available in BH 215 and CF 312. To get started with Mathematica visit my Mathematica page. There are several links to Wolfram's movies that are an easy introduction to this software.