- Here is the histogram of the final grades.
- Solutions for the Final Exam.
-
Here are pictures of the ice cream cone that we discussed on Wednesday.
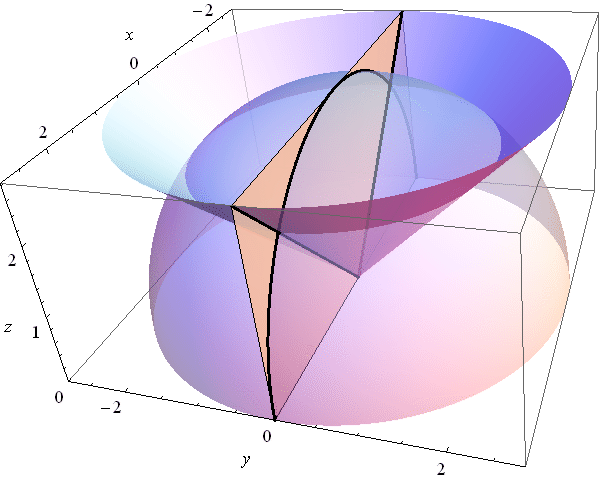
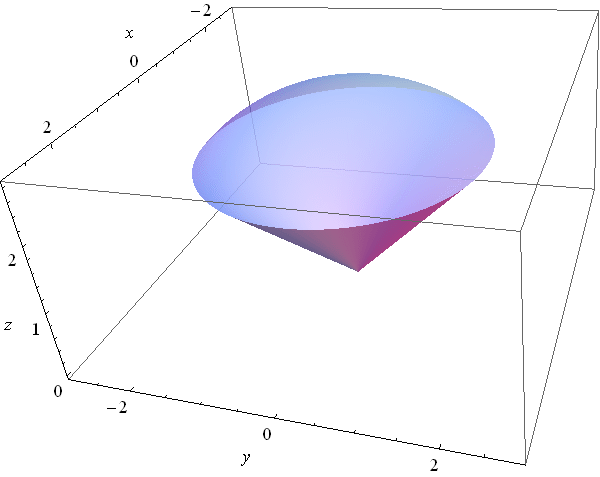
- Here is a tentative list of topics for the final exam. I marked four topics that will definitely appear on the final.
- Tomorrow we will do 16.5. The assigned problems are 1-20 (all, but in particular 9, 10, 11, 19, 20), 21-35, 36, 37, 38, 40, 42-45, 47, 49-52, 55-58.
-
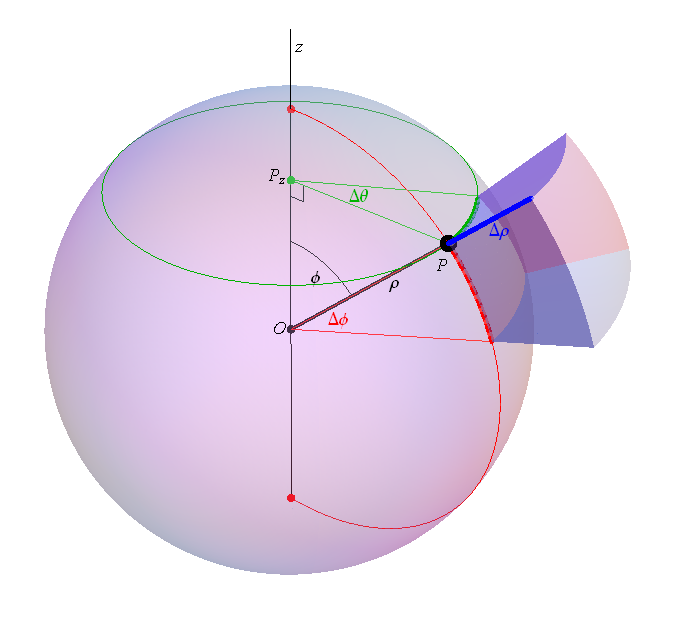
The most important formula to understand in this section is the volume element in spherical coordinates: $dV = \rho^2 (\sin \phi) \, d\theta\, d\phi \, d\rho$. I created the image below to help you understand this formula.
- The assigned problems for 16.4 are 1-7, 9, 12-15, 16-19, 20, 22, 24, 25, 27, 28, 29, 31, 32, 33, 35.
- Some relevant Chapter 16 Review exercises and problems are 14, 19, 20, 48, 49.
-
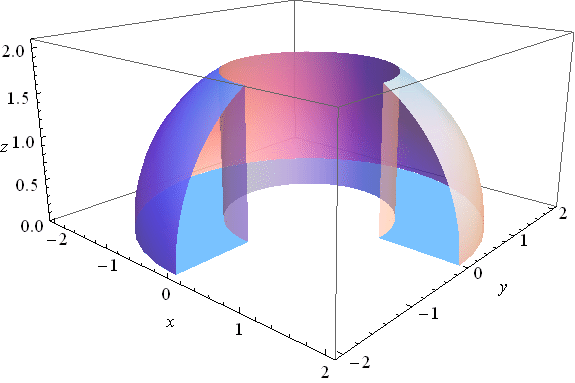
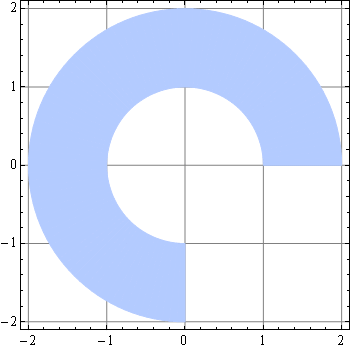
At the end of the class today I calculated the volume of a solid which was quite similar to the solid pictured below. This solid is part of a ball with radius 2 centered at the origin. We take only the part of the ball which is above the light blue "foundation" in $xy$-plane. The foundation is also pictured to the right.
- The assigned problems for 16.3 are 1-4, 5, 7, 8, 11, 12, 16, 18, 20-23, 25, 27, 32, 35, 36, 37, 38-55, 57, 58.
- The assigned problems for 16.1 are 1, 3, 5, 7, 9-24 (do most), 26, 30, 31.
- The assigned problems for 16.2 are 1-28 (do most), 31-36, 38, 40, 41, 50-54.
- Solutions for Exam 3. Here is the histogram of the grades on the third exam. Here is the histogram of the current grades.
- The third exam is on Friday. For this exam we covered 14.4, 14.5, 14.6, 14.7, 15.1 and a part of 15.2. The relevant examples in 15.2 are Examples 1 and 2 and Problems 17-23 at the end of 15.2.
- I updated Notes on Chapter 14.
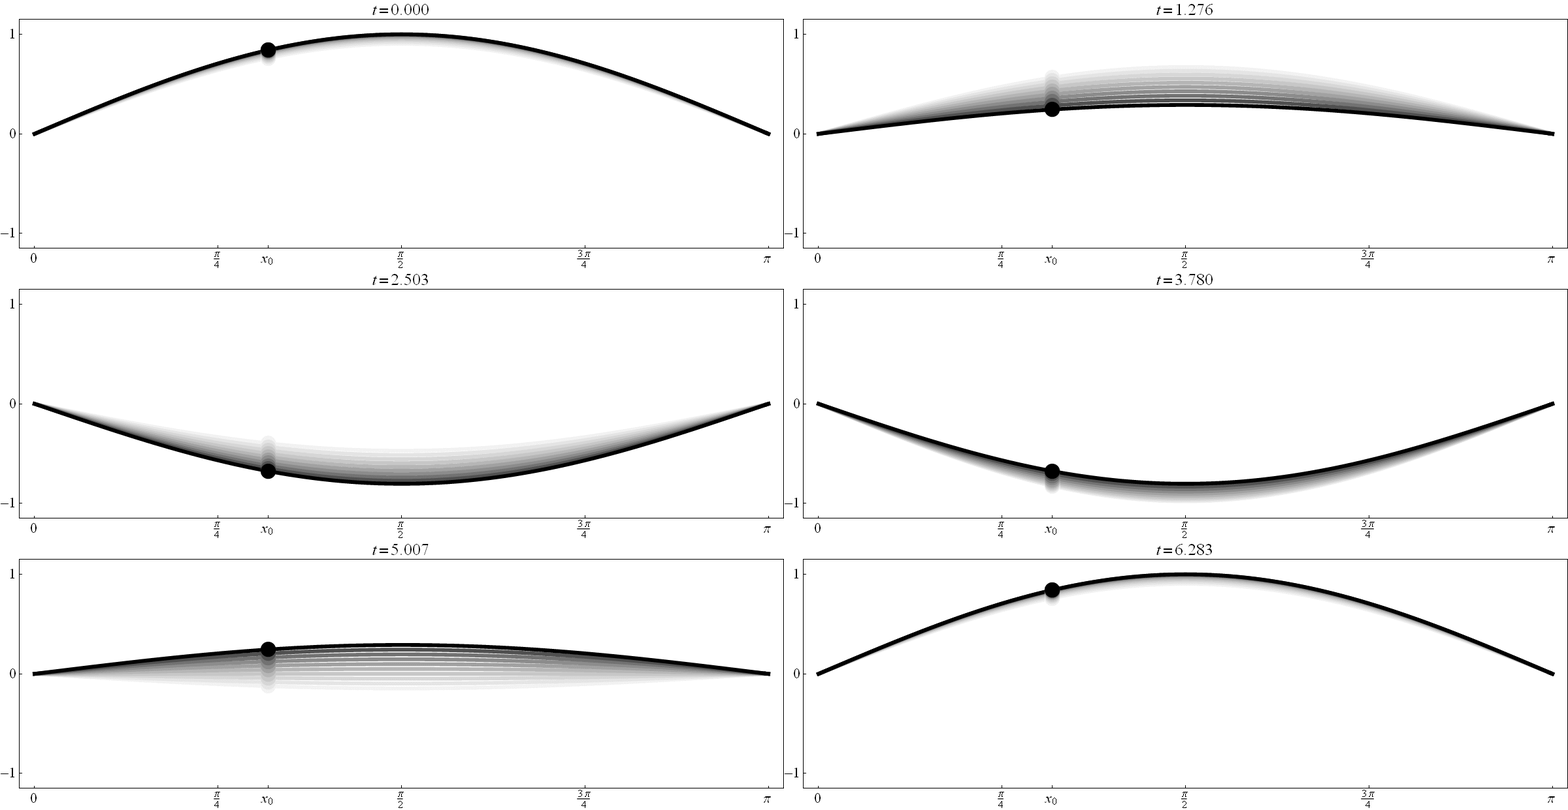
- Below is an oscillating string. Its equation is $y = F(x,t) = (\sin x) (\cos t)$. In the figure below $y$ is the vertical axis, $x$ is the horizontal axis and the time $t$ is displayed above the frame. The string at time $t$ is black. To indicate the motion of the string, I added several previous positions of the string in various shade of gray. In fact, the previous positions fade away. At each point in time $t_0 \in [0, 2 \pi)$ and for each point $x_0 \in [0,\pi]$ you should be able to determine the sign of the following quantities: \[ F(x_0,t_0), \ F_x(x_0,t_0), \ F_t(x_0,t_0), \ F_{xx}(x_0,t_0), \ F_{xt}(x_0,t_0), \ F_{tx}(x_0,t_0), \ F_{tt}(x_0,t_0). \] The best way to achieve this is to understand the meaning of each of these quantities. In fact, you should be able to determine the signs of the quantities listed above just based on one scene in the movie below and just based on a point emphasized on the graph of the string (even without explicitly given the values for $x_0$ and $t_0$).
Clicking on the image will cycle through 8 different individual scenes of this movie with various values of $x_0 \in [0,\pi]$.
- Solutions for Exam 2. Here is the histogram of the grades on the second exam. Here is the histogram of the current grades.
- The issue in this post we discussed last week. I did not post it earlier since I did not have the illustration below; I made it today. In the post on Wednesday, January 25, 2012 we studied unit vectors in two dimensions. Any such vector $\overrightarrow{u}$ is given as \[ \overrightarrow{u} = (\cos \theta) \overrightarrow{\imath} + (\sin \theta) \overrightarrow{\jmath}, \qquad \quad \theta \in [0,2 \pi). \]
-
Let now $\overrightarrow{v}$ be a unit vector in three-dimensional space. That is \[
\overrightarrow{v} = v_1 \overrightarrow{\imath} + v_2 \overrightarrow{\jmath} + v_3 \overrightarrow{k}.
\]
In the figure below the choice of colors is not random:
- $\overrightarrow{v}$ is the black vector;
- $\overrightarrow{\imath}$ is the red vector;
- $\overrightarrow{\jmath}$ is the green vector;
- $\overrightarrow{k}$ is the blue vector;
- the yellow vector is the unit vector in the direction of the projection of $\overrightarrow{v}$ onto $xy$-plane. Say, as before, \[ \overrightarrow{u} = (\cos \theta) \overrightarrow{\imath} + (\sin \theta) \overrightarrow{\jmath}, \qquad \quad \theta \in [0,2 \pi); \] The angle $\theta$ is also colored yellow.
- $\phi \in (0,\pi)$ is the gray angle between $\overrightarrow{v}$ and $\overrightarrow{k}$.
Click on the image to animate in $\theta$; double-click to animate in $\phi$.
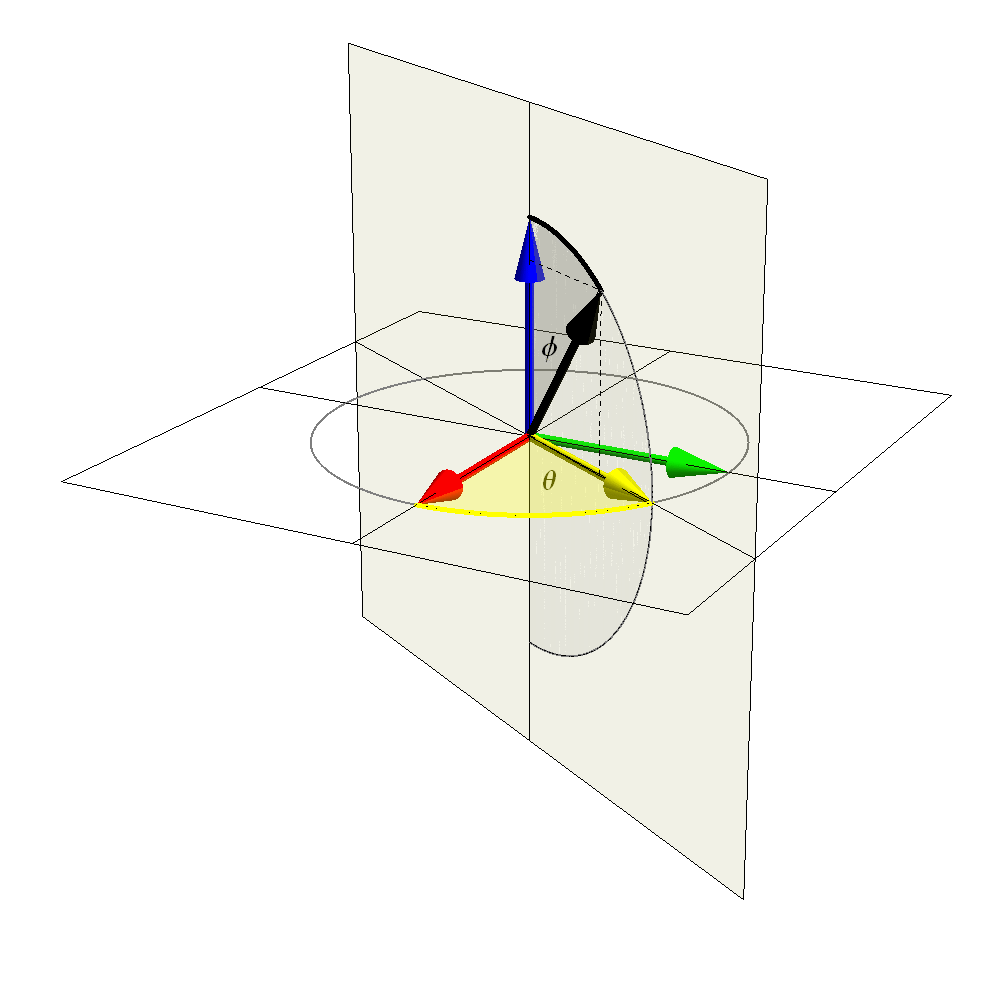
- In conclusion, each unit vector $\overrightarrow{v}$ in three-dimensional space is uniquely determined by two angles: the angle $\phi \in [0,\pi]$ between $\overrightarrow{v}$ and $\overrightarrow{k}$ and the angle $\theta \in [0,2 \pi)$ which is the angle between the projection of $\overrightarrow{v}$ onto $xy$-plane and $\overrightarrow{\imath}$. Then \[ \overrightarrow{v} = (\sin \phi)(\cos \theta) \overrightarrow{\imath} + (\sin \phi)(\sin \theta) \overrightarrow{\jmath} + (\cos \phi) \overrightarrow{k}. \]
- Here is the Mathematica file that I used in class today. The file is, I think appropriately, called VectorsInColor.nb
-
The picture below shows the unit circle in $xy$-plane. Each point on the unit circle is given by $\bigl(\cos \alpha, \sin \alpha\bigr)$ where alpha is a number in the interval $[0, 2\pi)$. This is what you learned in a trigonometry class. For us this is important since we can think of the point $\bigl(\cos \alpha, \sin \alpha\bigr)$ as a head of a unit vector $\overrightarrow{u}$ whose tail is at the origin. Then
\[
\overrightarrow{u} = (\cos \alpha) \overrightarrow{\imath} + (\sin \alpha) \overrightarrow{\jmath}.
\]
It is important to know components of unit vectors in standard directions. Below it the unit circle with the most important directions indicated and labeled by the corresponding angle. The corresponding cosines and sines are given. The picture below can be viewed as a "cheat sheet" of components for some of the most important unit vectors.
Click here to get a pdf file.
Mouse-over the image for a simplified version. -
I created the above image by modifying an image that I found at the Wikipedia page about the unit circle.
- You learned how to calculate the coordinates of the blue points in the above picture in a trigonometry class. (That is just an application of the Pythagorean theorem.)
- To calculate the coordinates of the red points in the above picture I used what we learned about vectors in this class. For example, denote by $\overrightarrow{u}$ the unit vector which forms the angle $\pi/8$ with $\overrightarrow{\imath}$, that is \[ \overrightarrow{u} = \Big(\cos \frac{\pi}{8}\Big) \overrightarrow{\imath} + \Big(\sin \frac{\pi}{8}\Big) \overrightarrow{\jmath}. \] Since both vectors \[ \overrightarrow{v} = \Big(\cos \frac{\pi}{4}\Big) \overrightarrow{\imath} + \Big(\sin \frac{\pi}{4}\Big) \overrightarrow{\jmath} = \frac{\sqrt{2}}{2} \overrightarrow{\imath} + \frac{\sqrt{2}}{2} \overrightarrow{\jmath} \qquad \text{and} \qquad \overrightarrow{\imath} \] are unit vectors, their sum \[ \overrightarrow{v} + \overrightarrow{\imath} =\frac{\sqrt{2}}{2} \overrightarrow{\imath} + \frac{\sqrt{2}}{2} \overrightarrow{\jmath} + \overrightarrow{\imath} = \frac{2+\sqrt{2}}{2} \overrightarrow{\imath} + \frac{\sqrt{2}}{2} \overrightarrow{\jmath} \] bisects the angle formed by $\overrightarrow{v}$ and $\overrightarrow{\imath}$. Therefore the vector $\overrightarrow{u}$ is the unit vector in the direction of the sum $\overrightarrow{v} + \overrightarrow{\imath}$. That is \[ \overrightarrow{u} = \frac{1}{\big\|\overrightarrow{v} + \overrightarrow{\imath}\big\|} \big( \overrightarrow{v} + \overrightarrow{\imath} \big) \] Next we calculate the magnitude of this sum: \[ \big\|\overrightarrow{v} + \overrightarrow{\imath}\big\| = \sqrt{\frac{1}{2} + \sqrt{2} + 1 + \frac{1}{2}} = \sqrt{2+\sqrt{2}}. \] Hence, we calculated the vector $\overrightarrow{u}$ to be \begin{align*} \overrightarrow{u} &= \frac{1}{\sqrt{2+\sqrt{2}}} \left( \frac{2+\sqrt{2}}{2} \overrightarrow{\imath} + \frac{\sqrt{2}}{2} \overrightarrow{\jmath} \right) \\ & = \frac{\sqrt{2+\sqrt{2}}}{2} \overrightarrow{\imath} + \frac{\sqrt{2}}{2\sqrt{2+\sqrt{2}}} \overrightarrow{\jmath} \\ & = \frac{\sqrt{2+\sqrt{2}}}{2} \overrightarrow{\imath} + \frac{\sqrt{2}\sqrt{2-\sqrt{2}}}{2\sqrt{2+\sqrt{2}}\sqrt{2-\sqrt{2}}} \overrightarrow{\jmath} \\ & = \frac{\sqrt{2+\sqrt{2}}}{2} \overrightarrow{\imath} + \frac{\sqrt{2}\sqrt{2-\sqrt{2}}}{2\sqrt{4-2}} \overrightarrow{\jmath} \\ & = \frac{\sqrt{2+\sqrt{2}}}{2} \overrightarrow{\imath} + \frac{\sqrt{2-\sqrt{2}}}{2} \overrightarrow{\jmath} \end{align*}
- As an exercise, use the above method to calculate the exact values of the cosine and the sine of the angle $\pi/12$.
- With the expressions for $\cos\bigl(\pi/8\bigr),\sin\bigl(\pi/8\bigr)$ and $\cos\bigl(\pi/12\bigr),\sin\bigl(\pi/12\bigr)$ all other expressions in the figure above can be obtained using the symmetries of the cosine and sine expressed by the following formulas \begin{alignat*}{2} \cos\Big(\frac{\pi}{2} - \alpha \Big) & = \sin \alpha & \qquad \qquad \sin\Big(\frac{\pi}{2} - \alpha \Big) & = \cos \alpha \\ \cos\Big(\frac{\pi}{2} + \alpha \Big) & = -\sin \alpha & \qquad \qquad \sin\Big(\frac{\pi}{2} + \alpha \Big) & = \cos \alpha \\ \cos\big(\pi - \alpha \big) & = -\cos \alpha & \qquad \qquad \sin\big(\pi - \alpha \big) & = \sin \alpha \\ \cos\big(\pi + \alpha \big) & = -\cos \alpha & \qquad \qquad \sin\big(\pi + \alpha \big) & = -\sin \alpha \\ \cos\Big(\frac{3\pi}{2} - \alpha \Big) & = -\sin \alpha & \qquad \qquad \sin\Big(\frac{3\pi}{2} - \alpha \Big) & = -\cos \alpha \\ \cos\Big(\frac{3\pi}{2} + \alpha \Big) & = \sin \alpha & \qquad \qquad \sin\Big(\frac{3\pi}{2} + \alpha \Big) & = -\cos \alpha \\ \cos\big(2\pi - \alpha \big) & = \cos \alpha & \qquad \qquad \sin\big(2\pi - \alpha \big) & = -\sin \alpha. \end{alignat*}
- Notes on Chapter 13
- Here is the Excel spreadsheet that I used in class. An xls version is here. This is how I see vectors arising in the Excel setting. In the file that you can download, I have random numbers in the cell range A1:E5. In the cell K4 I put the formula =A1. In this way I have determined a "cell displacement vector": "look 10 cells left and 3 cells up". When I copy the cell K4 to the clipboard, what Excel remembers is this displacement: "look 10 cells left and 3 cells up". So when I paste at the cell L4, then "look 10 cells left and 3 cells up" means B2. Analogously, for all the cells in the range K4:O8. I repeat the same procedure for the cell range C13:G17. Here the displacement vector is "2 cells left and 12 cells up".
- Here I post three Excel files in which I explore continuity of functions of two variable. The first one contains an example of a function which does not have a limit at (0,0). The second one contains an example of a function which does have a limit at (0,0).
- Here is an Excel file with the function studied in Example 1(b) in Section 12.6.
- A Mathematica file with several floor related functions of two variables is here. Recall that in Mathematica files individual cells with plotting commands can be executed by placing the cursor in the cell and pressing Shift+Enter.
- Here is the Mathematica file that I created in class today.
- Here is a Mathematica file in which I show several ways of plotting contours of functions of two variables. It is called LevelCurves.nb. As before, right-click on the underlined word "Here"; in the pop-up menu that appears, your browser will offer you to save the file in your directory. Make sure that you save it with the exactly same name. After saving the file follow the instructions below to open it and use it. Individual cells with plotting commands can be executed by placing the cursor in the cell and pressing Shift+Enter.
- Here is a Mathematica file in which I show how to visualize level surfaces of functions of three variables. It is called Contours3D1.nb.
- Tuesday, January 10, 2012
-
-
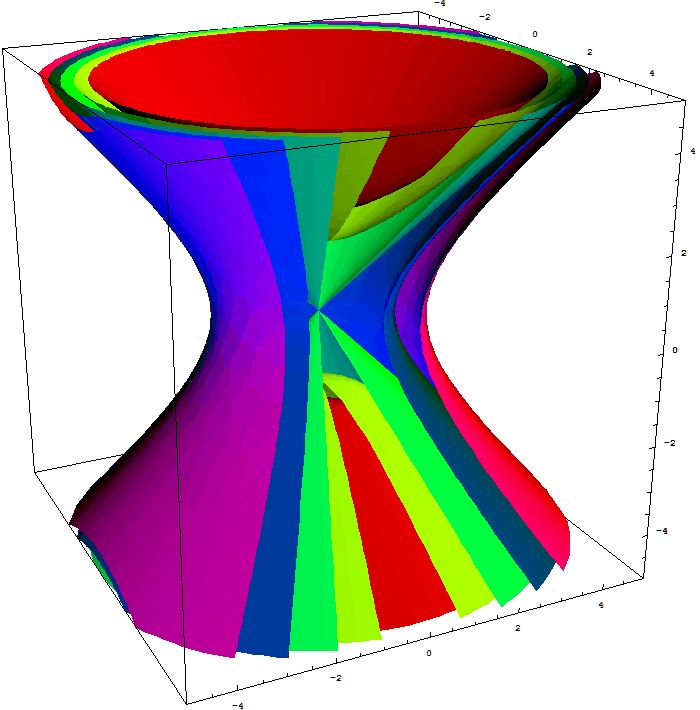
Here is an animation which shows level surfaces of the function $w = x^2 + y^2 - z^2$ studied in Example 3 in Section 12.5.
Place the cursor over the image to start the animation.
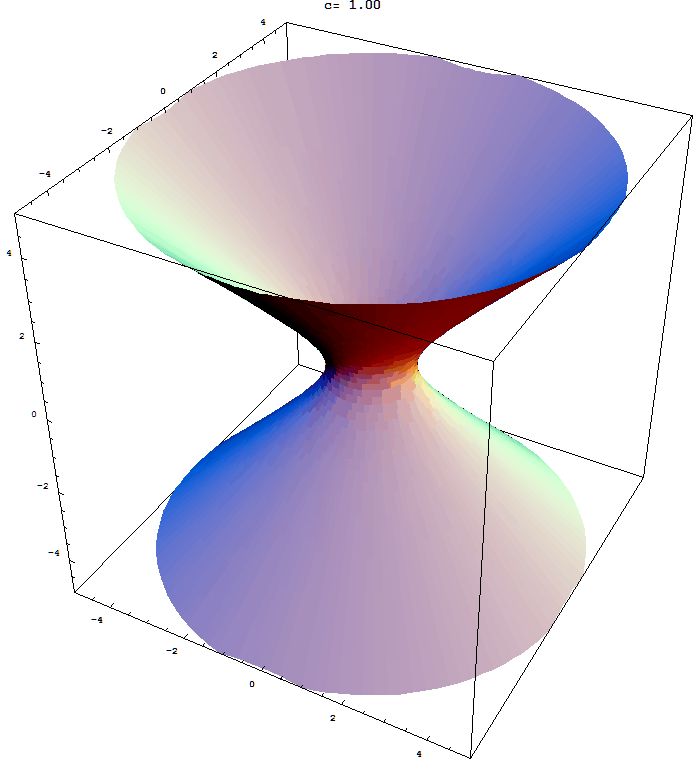
Five of the above level surfaces.
- Here is the Excel file which I used today. You can use it to explore linear functions.
-
Here is an animation which shows level surfaces of the function $w = x^2 + y^2 - z^2$ studied in Example 3 in Section 12.5.
- Thursday, January 5, 2012
-
- Today in class I demonstrated few 3-d plots in Mathematica version 5.2. On some campus computers we also have Mathematica version 8. These versions are not compatible. For this class I will only post version 5.2 notebooks since on campus there are more computers with version 5.2.
-
Here is the Mathematica file that I used. It is called 3DGraphs.nb. As before, right-click on the underlined word "Here"; in the pop-up menu that appears, your browser will offer you to save the file in your directory. Make sure that you save it with the exactly same name. After saving the file you can open it with Mathematica. You will find Mathematica on all campus computers in
Start -> All Programs -> Math Applications -> Mathematica. Open Mathematica first, then open 3DGraphs.nb from Mathematica. You can execute the entire file by the following manu sequence (in Mathematica):Kernel -> Evaluation -> Evaluate Notebook. There are some more instructions in the file. - Here is another Mathematica notebook that you might find useful.
- If you have problems running files that I posted please let me know. If you spend some time learning how to use these files you will enhance the understanding of math that we are studying and also learn the basics of these software packages.
- Here are some good Java applets for exploration of functions of two variables. At the end is a comprehensive list of web math tools from MIT.
-
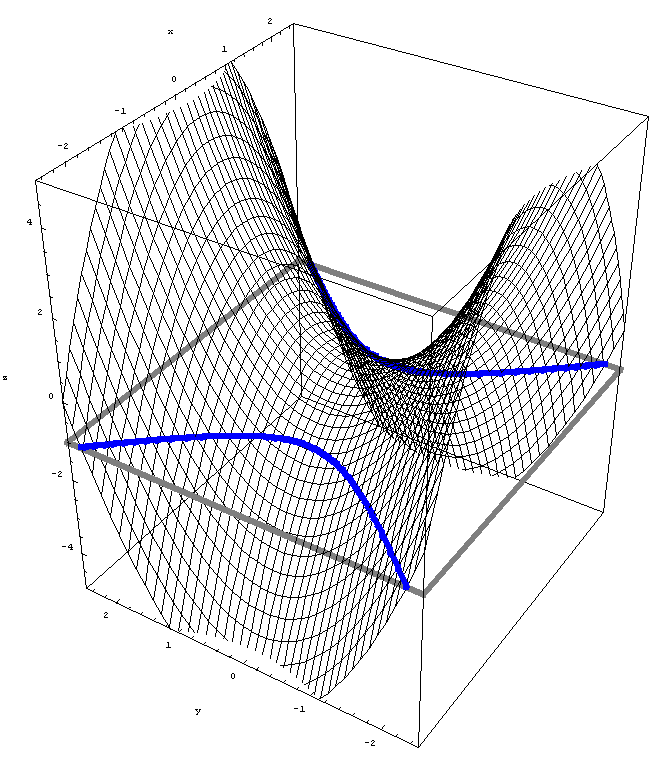
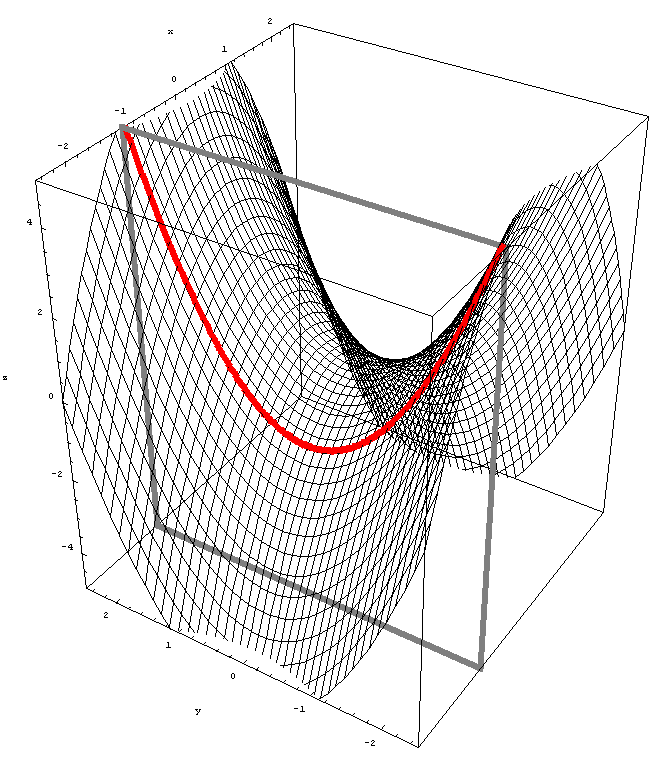
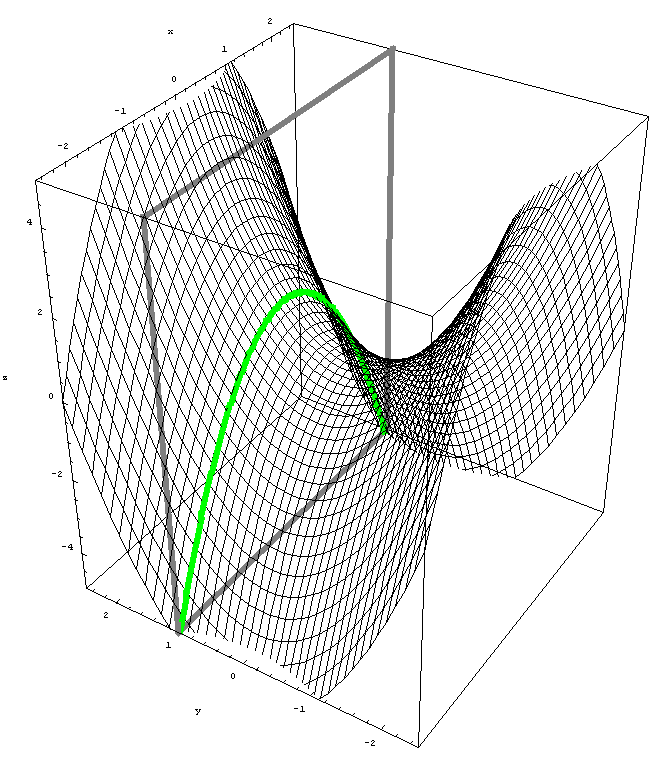
Here we explore the graph of the function $z = y^2 - x^2.$
-
First, an animation which shows level curves of the function $z = y^2 - x^2.$
Place the cursor over the image to start the animation.
-
Next, an animation of slices parallel to $yz$-plane. The function is $z = y^2 - x^2,$ as above.
Place the cursor over the image to start the animation.
-
Next, an animation of slices parallel to $zx$-plane. The function is $z = y^2 - x^2,$ as above.
Place the cursor over the image to start the animation.
-
First, an animation which shows level curves of the function $z = y^2 - x^2.$
-
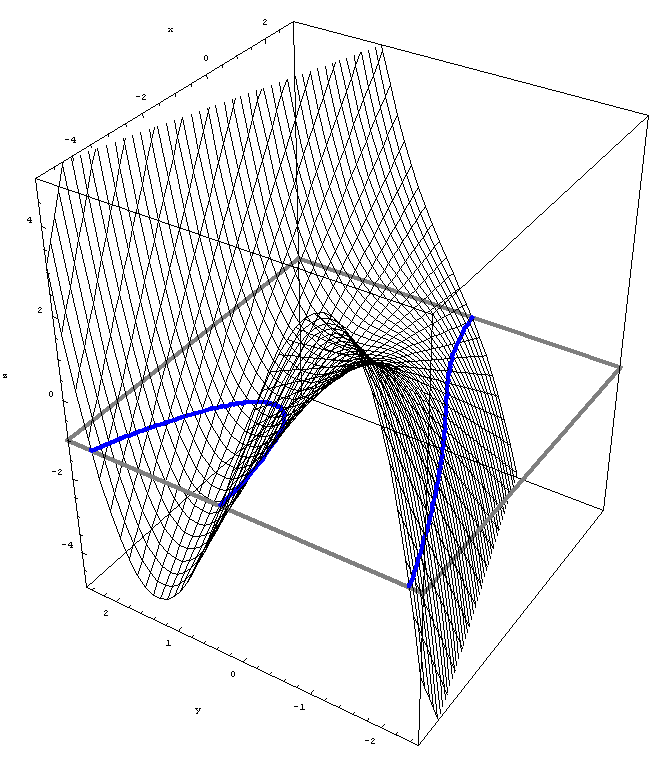
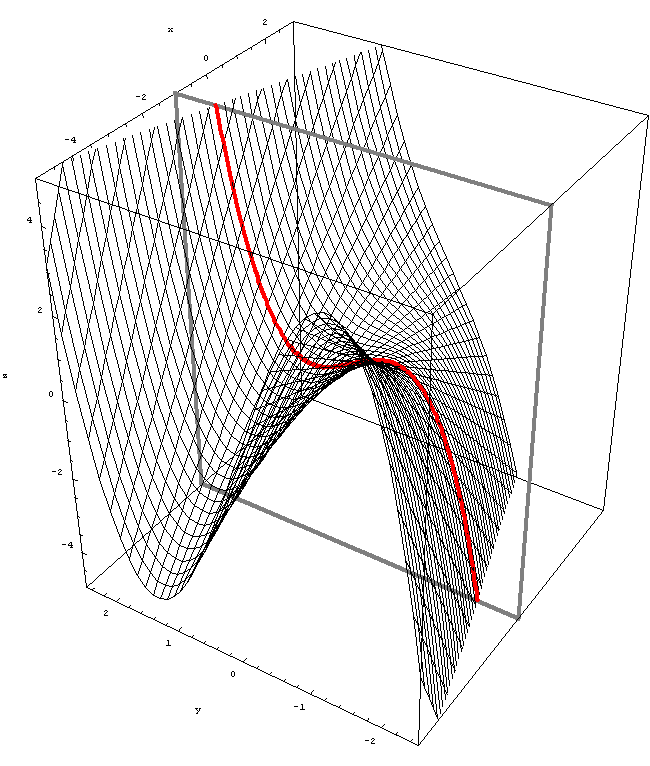
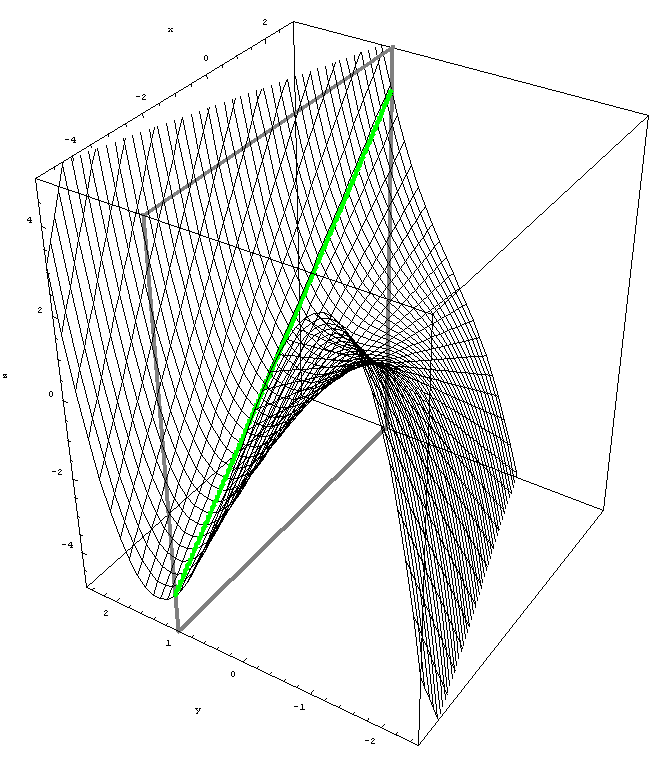
Here we explore the graph of the function $z = y^3 + xy.$
-
First, an animation which shows level curves of the function $z = y^3 + xy.$
Place the cursor over the image to start the animation.
-
Next, an animation of slices parallel to $yz$-plane. The function is $z = y^3 + xy,$ as above.
Place the cursor over the image to start the animation.
-
Next, an animation of slices parallel to $zx$-plane. The function is $z = y^3 + xy,$ as above.
Place the cursor over the image to start the animation.
-
First, an animation which shows level curves of the function $z = y^3 + xy.$
- Tuesday, January 3, 2012
-
- The information sheet
- Notes on Chapter 12
- Related Wikipedia links:
- Disk. Pay attention to the notation used in this (and all other) Wikipedia link. That is the standard mathematical set notation that is unfortunately not used in our textbook.
-
Sphere. There is too much stuff in this Wikipedia link. Some of it we will cover later in this class. Still, you can recognize few equations on this page. Pay attention to the sentence:
The moral here is that in mathematics words do have precise meanings. Pay attention!In higher mathematics, a careful distinction is made between the surface of a sphere (referred to as a “sphere”), and the inside of a sphere (referred to as a “ball”). - Euclidean distance. This page can give you a teste how the distance that we talked about today fits into a broader context.
- Here is the Excel file that I used in class today. In the file I give a step-by-step explanation how to create such files. You can explore other functions by creating similar Excel files.
- The proof of the distance formula in space is based on the Pythagorean theorem. As you can see in this Wikipedia page, there are many different proofs of the Pythagorean theorem.
- Here you will find a visual proof of Pythagorean theorem that I designed.