- For Section 21.3 do Exercises 1, 3, 5, 7, 8, 9, 10, 11, 12, 13, 14, 16, 17, 18, 19.
- Today I solved the Length part of Problem 4 on the Assignment. Read this Mathematica notebook for the details. Here is a pdf printout of the same notebook.
-
The final product of the notebook in the preceding item is the family of ellipses with circumference $2\pi$.
Place the cursor over the image to start the animation.
-
And finally we can place the ellipses from the preceding animation in three space at different $z$-levels. In the parametric plot below I placed the wide ellipses at negative $z$ levels and the tall ellipses at positive $z$-levels.
Place the cursor over the image to start the animation.
- For Section 20.3 do Exercises 3, 6, 7, 8-11, 13-16, 23-26, 29, 30-35, 37, 38.
- On Monday and Tuesday I explained why the vector Curl gives the circulation density in any direction. The summary of my reasoning is in this pdf file. I created this pdf file using this Mathematica notebook.
- For Section 20.1 do Exercises 5, 6, 9, 10, 11, 12, 16, 17, 19, 22, 24, 25-31.
- For Section 20.2 do Exercises 3, 4, 5, 8, 9, 10, 12, 13, 14, 16, 20, 23, 24, 25, 26, 27, 28, 30, 31, 32, 33, 34.
- For Section 19.4 do Exercises 4, 5, 8, 12, 13, 14, 16, 17, 19, 21, 22, 24, 25, 27, 28, 30, 31, 32.
- For Section 19.2 do Exercises 3, 4, 6, 7, 10, 12, 14, 15, 20, 22, 23, 26, 27, 29, 30, 33, 35, 38, 39, 42, 43, 45, 47, 49, 52, 56.
- For Section 19.3 do Exercises 2, 3, 4, 5, 6, 9, 11, 12, 13, 17, 18, 19, 20, 21, 24, 26, 27, 29, 34, 35, 36, 37, 38, 39, 40.
-
Today I posted the first assignment. The assignment is posted as a Mathematica notebook. You are expected to submit your work as a Mathematica notebook. I will explain a procedure in an email.
- The Mathematica file with the assignment you can download here. The file is called 201720_A1.nb. Right-click on the underlined link; in the pop-up menu that appears, your browser will offer you to save the file in your directory. Make sure that you save it with the exactly same name. After saving the file you can open it with Mathematica 8. You will find Mathematica 8 on computers in BH 215 and CF 312. Open Mathematica first, then open 201720_A1.nb from Mathematica. To get started with Mathematica visit my Mathematica page. There are several links to Wolfram's movies that are an easy introduction to this computer algebra system.
- When you open the file 201720_A1.nb you can go through the notebook cell by cell and evaluate each cell individually, or you can evaluate the entire notebook by the keyboard sequence Alt+v o or with the manu item Evaluate ⇾ Evaluate Notebook.
- I printed out the assignment file as a pdf document so that you can read it without having access to Mathematica.
- I aslo saved the assignment file as an html document so that you can read it without having access to Mathematica.
- For Section 19.1 do Exercises 7, 10, 11, 18, 20, 22, 25, 26, 34, 36, 38, 45, 46, 48, 50, 53, 55, 56, 57, 60, 61, 65.
- I was asked to do Problem 29 in Section 18.4. This problem deals with the Folium of Decartes curve. As pointed out in the book this curve is given by implicit equation \[ x^3+y^3 - 3 x y =0. \] The vector equation for this curve is \[ \left\langle \frac{3t}{1+t^3}, \frac{3t^2}{1+t^3} \right\rangle, \qquad t \in (-\infty,-1) \cup (-1,+\infty). \]
-
Since the technology failed us today I had to figure out the shape of this curve by hand. What did I do? I intersected the curve with the lines $y = c -x.$ I substituted this in the implicit equation $x^3+y^3 - 3 x y =0.$ The resulting equation was a quadratic equation in $x$ with $c$ as a parameter. I found this interesting trichotomy:
- For $c = 0$ and $c = 3$ we have a unique solution for $x$. So we found that the points $(0,0)$ and $(3/2,3/2)$ are on the curve. These are the black and the red point on the picture below.
- For $c \in (-1,0) \cup (0,3)$ we have two distinct solutions for $x$. These solutions result in two points on the curve which are symmetric with respect to the line $y=x$ and lie on the line $y=c-x$ symmetric with respect to the point $(c/2,c/2).$ A pair of such points are the points $\bigl(2^{2/3},2^{2/3}\bigr)$ and $\bigl(2^{2/3},2^{2/3}\bigr).$ The first of these points is maroon and the second is light red on the picture below. For a positive $c$ the corresponding points lie in the first quadrant, one above, the other below the diagonal. For negative $c$ one of the points lies in the second and the symmetric one in the fourth quadrant.
- For $c \in (-\infty,-1]\cup (3, + \infty)$ there are no solutions for $x$. That is, for such $c$-s the lines $y=c-x$ do not intersect the given curve. The significance of the line $y = -1 - x$ is that it is an asymptote for the curve.
-
With the above analysis of the Folium of Decartes we understand the plot below better.
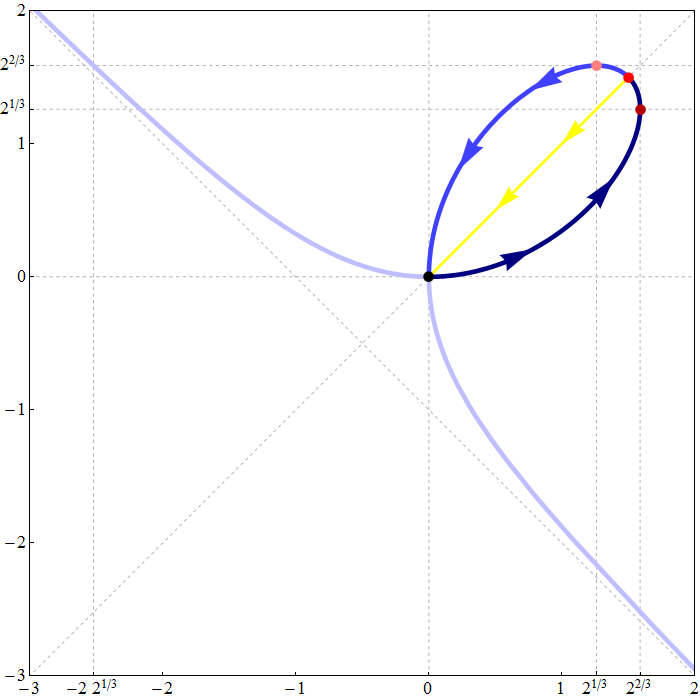 On the plot above I emphasised the part of the curve corresponding to $t \in (0,1)$ in dark blue. That is the part between the black and the red point which is below the diagonal and contains the maroon point. The part between the red and black point which is above the diagonal is in blue. This part contains the light red point. On the curve I indicated the direction of the increasing $t$ by arrows.
- We were asked to calculate the area in the first quadrant enclosed by the curve. The part of the curve in the first quadrant corresponds to the parameter $t \in [0,+\infty).$ To calculate the area we need to evaluate the following line integral \begin{align*} \oint_C x \vec{\jmath} \cdot d\vec{r} & = \int_0^{\infty} \left\langle 0, \frac{3t}{1+t^3} \right\rangle \cdot \left\langle \frac{3-6 t^3}{\left(t^3+1\right)^2}, \frac{3 t \left(2 - t^3\right)}{\left(t^3+1\right)^2} \right\rangle dt \\ & = \int_0^{\infty} \frac{9 t^2 \left(2 - t^3 \right)}{\left(t^3+1\right)^3} dt \\ & = \int_0^{\infty} \frac{18 t^2 }{\left(t^3+1\right)^3} dt - \int_0^{\infty} \frac{9t^5}{\left(t^3+1\right)^3} dt \\ & = \int_1^{\infty} \frac{6}{u^3} du - \int_1^{\infty} \frac{3(u-1)}{u^3} du \\ & = 9 \int_1^{\infty} \frac{1}{u^3} du - 3 \int_1^{\infty} \frac{1}{u^2} du \\ & = -\frac{9}{2} \left. \frac{1}{u^2} \right|_1^{\infty} + 3 \left. \frac{1}{u} \right|_1^{\infty} \\ & = \frac{9}{2} - 3 \\ &= \frac{3}{2} \end{align*}
- In the above calculation we encountered in improper integral and one is justified in being a little suspicions about the validity of that method. Luckily, in this problem we can avoid the improper integral by calculating one-half of the asked area which is below the diagonal. To acomplish this we need to calculate the line integral of the same vector field along the yellow oriented line in the picture above. This line integral equals \[ \int_0^{3/2} \left\langle 0, \frac{3}{2} - s \right\rangle \cdot \left\langle -1,-1 \right\rangle ds = \int_0^{3/2} \left( s - \frac{3}{2} \right) ds = -\frac{9}{8} \] Now we calculate the line integral along the dark blue part of the curve. The parameter $t \in [0,1]$ in this case. \begin{align*} \int_{C_b} x \vec{\jmath} \cdot d\vec{r} & = \int_0^{1} \left\langle 0, \frac{3t}{1+t^3} \right\rangle \cdot \left\langle \frac{3-6 t^3}{\left(t^3+1\right)^2}, \frac{3 t \left(2 - t^3\right)}{\left(t^3+1\right)^2} \right\rangle dt \\ & = \int_0^{1} \frac{18 t^2 }{\left(t^3+1\right)^3} dt - \int_0^{1} \frac{9t^5}{\left(t^3+1\right)^3} dt \\ & = \int_1^{2} \frac{6}{u^3} du - \int_1^{2} \frac{3(u-1)}{u^3} du \\ & = -\frac{9}{2} \left. \frac{1}{u^2} \right|_1^{2} + 3 \left. \frac{1}{u} \right|_1^{2} \\ & = - \frac{9}{8} + \frac{9}{2} + \frac{3}{2} - 3 \\ &= \frac{15}{8} \end{align*} Thus, the area is $2(15/8 - 9/8) = 3/2.$
- For Section 18.4 do Exercises 1, 2, 6, 7, 11, 14, 16, 20, 22, 24, 25 (the field involved in (b) is a gradient field), 26, 27, 28, 29, 30, 33, 34, 35, 37, 38.
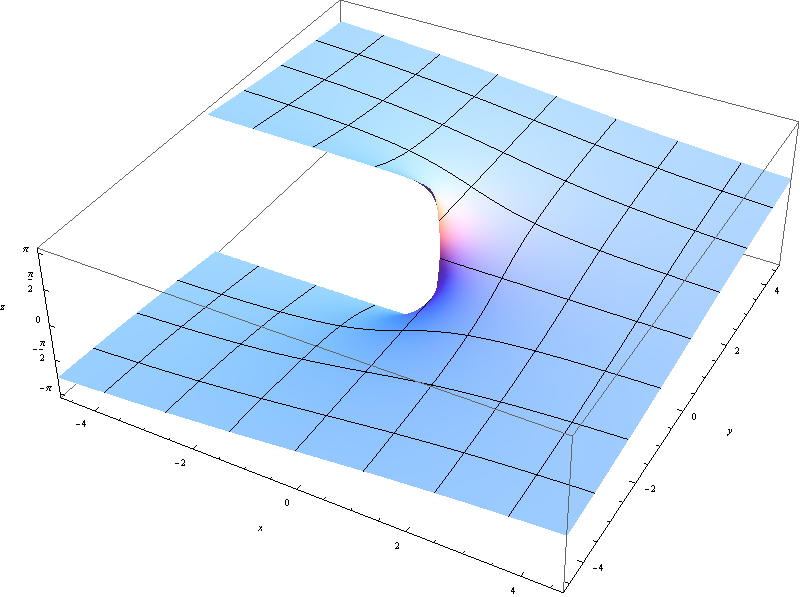
- Section 18.4 is a very interesting section. I tried to clarify the dependence of the Curl Tests for vector fields on the domain. For example, the vector field \[ \vec{F} = -\frac{y}{x^2+y^2} \vec{\imath} + \frac{x}{x^2+y^2} \vec{\jmath} \] is not a gradient field over its domain \[ D = \bigl\{(x,y) \in {\mathbb R}^2 : x^2 + y^2 \neq 0 \bigr\}. \] However, if we restrict the domain to \[ D^\prime = \bigl\{(x,y) \in {\mathbb R}^2 : y \neq 0 \ \text{or} \ x \gt 0 \bigr\}, \] then the vector field $\vec{F}$ is a gradient field. In fact, $\vec{F}$ is the gradient of the function \[ f(x,y) = \begin{cases} -\arctan(x/y) + \pi/2 & \quad \text{if} \quad y \gt 0, \\ \phantom{-}0 & \quad \text{if} \quad y = 0 \quad \text{and} \quad x \gt 0 , \\ -\arctan(x/y) - \pi/2 & \quad \text{if} \quad y \lt 0. \end{cases} \] Notice that the domain of the function $f$ is exactly the set $D^\prime$. Also, notice that $D^\prime$ is the plane from which the origin and the negative $x$-half-axis have been removed.
-
The formula for $f(x,y)$ above looks complicated but this is not too complicated function. Here is its plot.
-
On the first exam I asked you to calculate the following yellow area.
 For the homework I asked you to calculate the volume of the house built on this yellow foundation with the roof at the level $z= x e^x$. The lowest level of this roof is $1/2 \sqrt{e} \approx 0.824361$ at the point $(1/2,2).$ The highest level of this roof is $4e^4 \approx 218.393$ at the point $(4,1).$ It is difficult to to plot a graph with such large difference in the highest and the lowest value. Therefore, instead of the function $x e^x,$ I will use $x e^{x/8}$ in the plot below. For this new roof function the lowest and the highest levels are approximately $0.532247$ and $6.59489.$ This is really a beautiful architectural design, so I wanted to share it with you.
Place the cursor over the image to start the animation.
-
Today I explained how to find parametric equations of a wall-like surface.
Place the cursor over the image to start the animation.
- All this is in the linked Mathematica notebook called 225_E1_201720_P4.nb. I also created a pdf printout of the Mathematica notebook, so that you can enjoy it even without access to Mathematica.
- For Section 18.3 do Exercises 1, 3, 4, 13, 14, 16, 23, 25, 26, 28, 29, 31-34, 36, 39, 40, 42, 44, 53.
- For Section 18.1 do Exercises 1-5, 10, 13, 14, 15, 17, 18, 20, 22, 25, 27, 29, 30, 32, 33, 37-41, 43, 45, 46, 47, 54-67.
- For Section 18.2 do Exercises 3, 5, 7, 13, 14, 16, 22, 23, 26-31, 32, 35, 40, 42-56.
- Inspired by Exercises 18, 19, 20, 21 in Section 17.4 I wrote a webpage about orthogonal families of curves
- Today in class I used this Mathematica file. The file is called VectorFields_v8.nb. Right-click on the underlined link; in the pop-up menu that appears, your browser will offer you to save the file in your directory. Make sure that you save it with the exactly same name. After saving the file you can open it with Mathematica 8. You will find Mathematica 8 on computers in BH 215 and CF 312. Open Mathematica first, then open VectorFields_v8.nb from Mathematica. Here is a pdf printout of the above Mathematica file.
- For Section 17.3 do Exercises 1-10, 12, 15, 16, 17, 19, 20, 21, 27, 28, 29, 32, 33, 34, 36, 37, 38.
- For Section 17.4 do Exercises 6, 7, 8, 9, 16, 17, 19, 20, 21, 22, 23, 26, 29, 36, 37.
- For Review Chapter 17 do Exercises 12, 23, 25, 26, 36, 38, 39, 41, 42, 52.
-
Below I list few additional problems in which change of coordinates in double integrals is quite helpful.
- Evaluate the finite area in the first quadrant bounded by the graphs of the following functions: $y=1/(3x)$, $y = 1/x$, $y = 2x$, $y = x/2$.
- Let $n$ be a positive integer greater than $1$. Denote by $A_n$ the finite area in the first quadrant bounded by the graphs of the following functions: $y=1/(nx)$, $y = 1/x$, $y = 2x$, $y = x/2$. Find the following limit $\lim_{n\to\infty} A_n.$ Verify your answer by calculating two single integrals.
- Evaluate the double integral $\iint_R \exp\left(\frac{x-y}{x+y}\right) dA$ where the region $R$ is the triangle with the vertices $(0,0),$ $(1,0),$ $(0,1).$ This integral is in some sense improper integral since the function $\exp\left(\frac{x-y}{x+y}\right)$ is not defined at $(0,0).$ It turns out that this is not a problem in evaluation. However, if one wants to be rigorous, one can calculate the integral over the trapezoid with vertices $(0,a),$ $(a,0),$ $(1,0),$ $(0,1),$ where $a \gt 0,$ and then take the limit as $a \to 0.$
- Let $n$ be a positive integer. Evaluate the double integral $\iint_R (x+y)^n dA$ where the region $R$ is the triangle with the vertices $(0,0),$ $(1,0),$ $(0,1).$
- Let $n$ be a positive integer. Evaluate the double integral $\iint_R (x-y)^n dA$ where the region $R$ is the triangle with the vertices $(0,0),$ $(1,0),$ $(0,1).$
- Let $a$ and $b$ be positive real numbers such that $a \lt b.$ Let $S_a$ be the sphere with radius $a$ and let $S_b$ be the sphere with radius $b$ both centered at the origin. Evaluate the triple integral $\iiint_W (x^2+y^2+z^2)^{-3/2} dV$ where $W$ is the region inside the sphere $S_b$ and outside the sphere $S_a.$
- The exam will cover 16.1 through 16.5, 17.1, 17.2, 21.1 and 21.2.
- For Section 21.2 do Exercises 5, 6, 9, 10, 11, 13, 14, 15, 16.
- For Section 17.2 do Exercises 5, 6, 10, 12, 15, 16, 18, 19, 21, 22, 24, 27, 28, 30, 32, 40 (the direction of the motion of the wheel is wrong; it should be $\vec{\imath}$), 43
- For Section 21.1 do Exercises 2,5-12, 14-22, 27-30, 32-35, 37-48
- I am working on the this Mathematica notebook called Curves_Surfaces.nb. In this notebook I am trying to present what I did in class yesterday in an extended and more organized way. It is a work in progress, but I believe it is worth looking into.
-
Below I list few problems in which arc length of a curve can be calculated explicitly.
- Problem 1. Calculate the arc length of the graph of the function $y = x^{3/2}$ between the points $(0,0)$ and $(1,1)$.
- Problem 2. Calculate the arc length of the graph of the function $y= (1/4) x^2-(1/2) \ln x$, between the points $(1,1/4)$ and $\bigl(e,(e^2-2)/4\bigr)$.
- Problem 3. Calculate the arc length of the cycloid given by the parametric equations \[ x(t) = t- \sin t , \quad y(t) = 1-\cos t \quad \text{where} \quad 0 \leq t \leq 2 \pi. \]
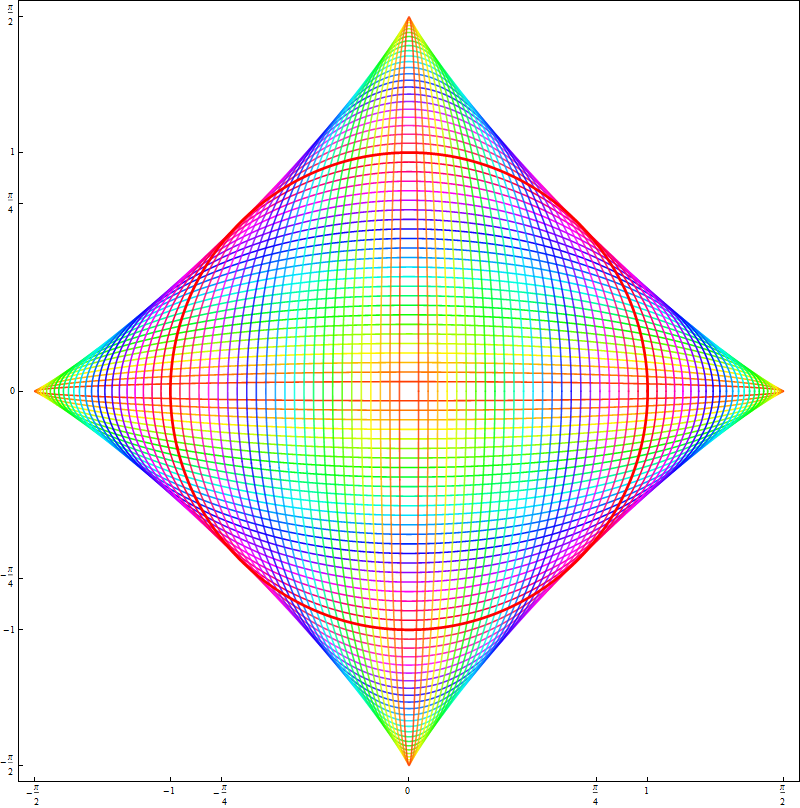
- Problem 4. Calculate the arc length of the astroid curve given by the parametric equations \[ x(t) = (\cos t)^3, \quad y(t) = (\sin t)^3 \quad \text{where} \quad 0 \leq t \leq 2 \pi. \]
- Problem 5. Calculate the arc length of the spiral given by the parametric equations \[ x(t) = (\exp t)(\cos t), \quad y(t) = (\exp t)(\sin t) \quad \text{where} \quad -\pi \leq t \leq \pi. \]
- Problem 6. Calculate the arc length of the cardioid given by the parametric equations \[ x(t) = (1+\cos t)\cos t, \quad y(t) = (1+\cos t) \sin t \quad \text{where} \quad 0 \leq t \leq 2\pi. \]
-
Today in class I continued what we did on Friday. I modified the file
this Mathematica file. The file is called 20170407.nb. Right-click on the underlined link; in the pop-up menu that appears, your browser will offer you to save the file in your directory. Make sure that you save it with the exactly same name. After saving the file you can open it with Mathematica 8. You will find Mathematica 8 on computers in BH 215 and CF 312. Look in
Start -> All Programs -> Wolfram Mathematica -> Mathematica 8. Open Mathematica first, then open 20170407.nb from Mathematica. - Mathematica 8 which is available in BH 215 and CF 312. To get started with Mathematica visit my Mathematica page. There are several links to Wolfram's movies that are an easy introduction to this software.
- For Section 17.1 do Exercises 2, 3, 5, 8, 30, 34, 37, 40, 49, 50, 51, 52, 54, 62, 68, 72, 82.
- Today we review integration in polar coordinates. The most important concept here is the area element in polar coordinates: $dA = r \, d\theta \, d r$.
-
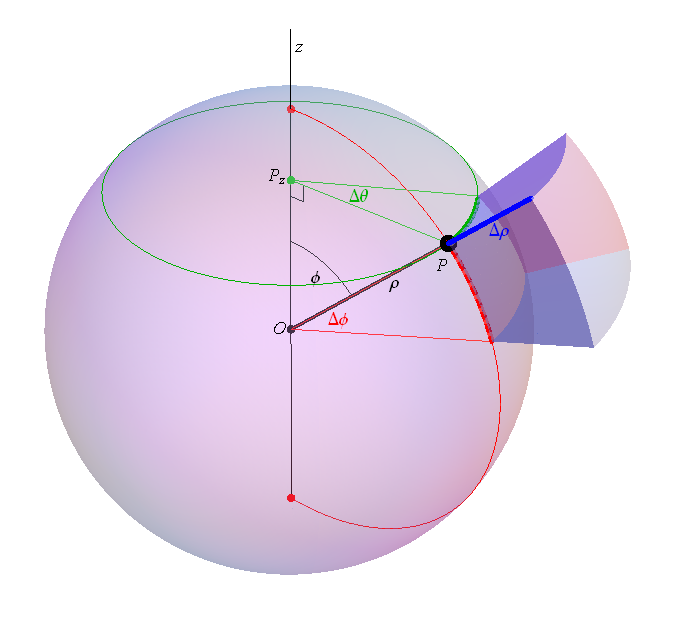
To enrich our toolbox for calculating triple integrals we need to understand cylindrical and spherical coordinates. The most important concepts here are the volume element in cylindrical coordinates: $dV = r \, d\theta \, d r \, dz$ and
the volume element in spherical coordinates is: $dV = \rho^2 (\sin \phi) \, d\theta\, d\phi \, d\rho$. I created the image below to help you understand this formula.
- For the animation of the unit vectors in 3 dimension which can help you understand the spherical coordinates better click here .
-
Today we discussed the question of average value of a function of two and three variables. Basic questions related to this concept are questions involving average distance.
-
For example: What is the average distance of a point in a unit disk to its center? Let $D$ be the unit disc centered at the origin. The average distance is $(1/\pi) \iint_D \sqrt{x^2+y^2}dA$. The double integral involved is the volume below.
-
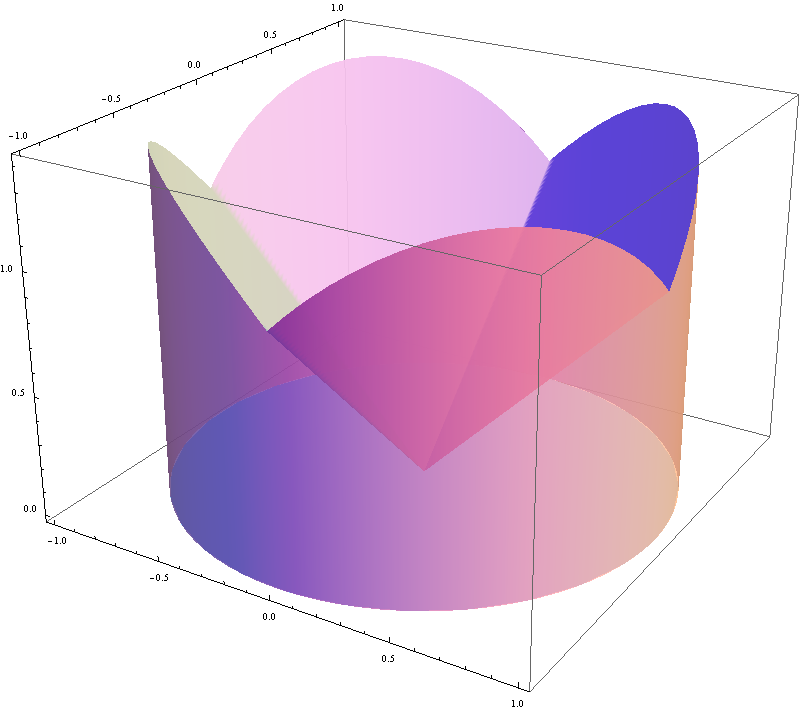
In the previous item we used so called Euclidean distance to calculate the distance from the origin. Another popular distance that is more alike what we experience in everyday life is so called taxicab distance. In taxicab distance the distance of the point $(x,y)$ to the origin is $|x|+|y|$. Thus, the average distance of a point in a unit disk $D$ to its center is
$$
\frac{1}{\pi} \iint_D (|x|+|y|)dA
$$
The double integral involved is the volume below.
-
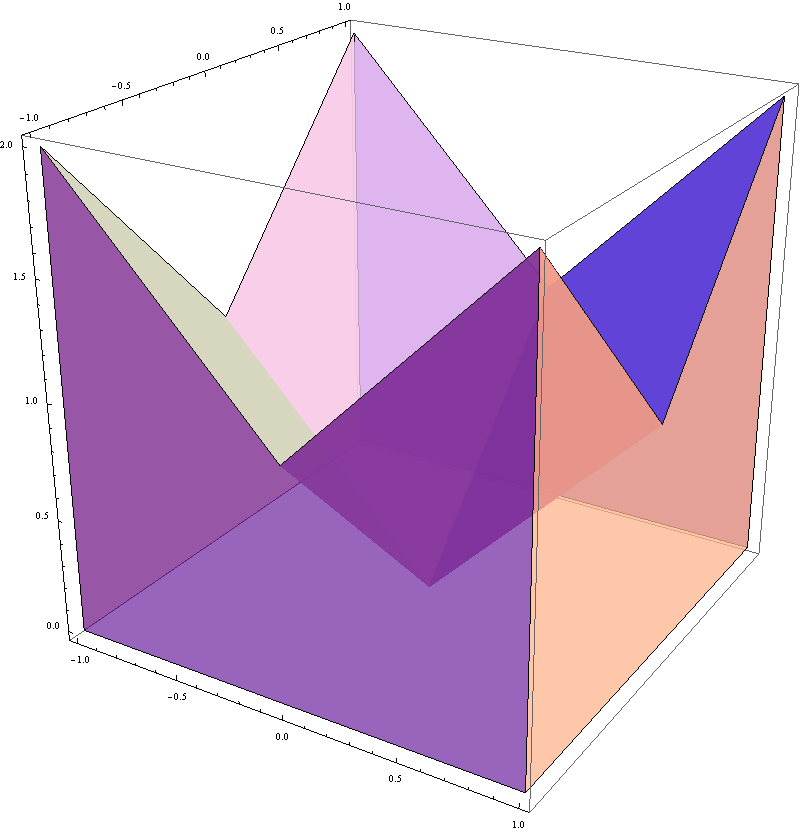
The calculation in the previous item becomes simpler if we replace the unit disk with the square with the corners: $(-1,-1)$, $(-1,1)$, $(1,1)$, $(-1,1)$. Call this square $S$. Using the taxicab distance find the average distance of the point $(x,y)$ in the square $S$ to the origin. The average distance of a point in the square $S$ to the origin is
$$
\frac{1}{4} \iint_S (|x|+|y|)dA
$$
The double integral involved is the volume below.
-
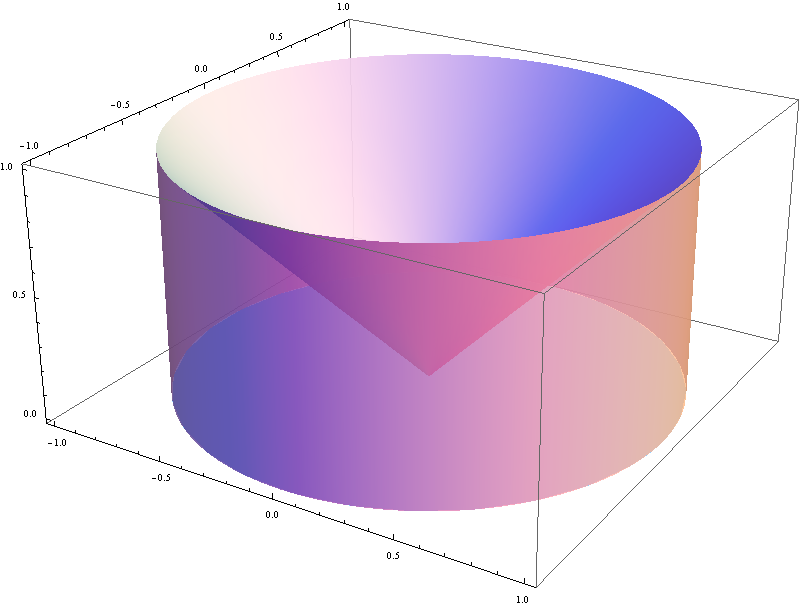
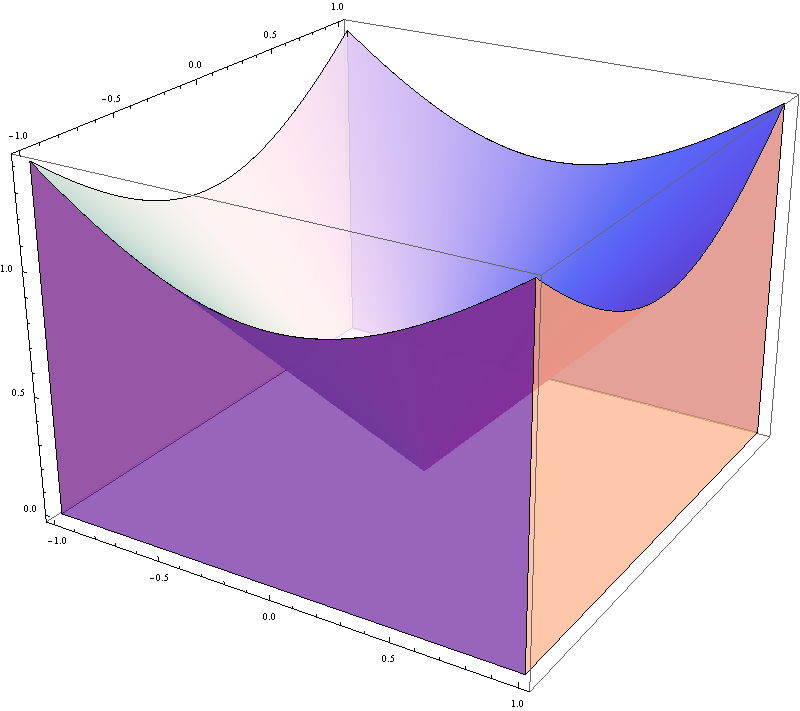
The calculation becomes more involved if we replace the taxicab distance with the Euclidean distance in the square $S$ with the corners: $(-1,-1)$, $(-1,1)$, $(1,1)$, $(-1,1)$. Using the Euclidean distance the average distance of a point in the square $S$ to the origin is
$$
\frac{1}{4} \iint_S \sqrt{x^2 + y^2}\, dA
$$
The double integral involved is the volume below.
- Next, it would be interesting to repeat all these calculations by replacing the unit disk with the unit ball and the square $S$ with the cube $C$ with the corners at the coordinates at the eight points involving $1$ and $-1$. In the items below we will use $B$ to denote the unit ball. Recall that the volume of the unit ball is $4\pi/3.$
- Find the average Euclidean distance of a point in the unit ball $B$ to the origin. This average is given by the integral $$ \frac{3}{4\pi} \iiint_B \sqrt{x^2 + y^2+z^2}\, dV . $$ The triple integral is calculated in spherical coordinates as \begin{align*} \iiint_B \sqrt{x^2 + y^2+z^2}\, dV & = \int_0^1 \int_0^{2\pi} \int_0^{\pi} \rho^3 \sin \phi \, d\phi d\theta d\rho \\ & = 2\pi \ \frac{1}{4} (\rho^4) \Bigl. \Bigr|_0^1 \ ( -\cos \phi)\Bigl. \Bigr|_0^1 \\ & = \pi \end{align*} Thus the average is $3/4.$
- Find the average taxicab distance of a point in the unit ball $B$ to the origin. This average is given by the integral $$ \frac{3}{4\pi} \iiint_B (|x|+|y|+|z|)\, dV . $$ Denote by $B_1$ the part of the unit ball which is in the first octant. The triple integral is calculated in spherical coordinates as \begin{align*} \iiint_B (|x|+|y|+|z|)\, dV & = 8 \int_0^{\pi/2} \int_0^{\pi/2} \int_0^1 ((\cos \theta) (\sin \phi)+(\sin \theta) (\sin \phi)+ \cos\phi ) \rho^3 \sin \phi \, d\rho d\phi d\theta \\ & = 2 (\rho^4) \Bigl. \Bigr|_0^1 \int_0^{\pi/2} \int_0^{\pi/2} \left( (\cos \theta) (\sin \phi)^2+(\sin \theta) (\sin \phi)^2+ (\cos\phi) (\sin \phi) \right) d\phi d\theta \\ & = 2 \left( \frac{\pi}{4} + \frac{\pi}{4} + \frac{\pi}{4} \right) \\ &= \frac{3\pi}{2} \end{align*} Thus the average is $9/8.$
- Find the average taxicab distance of a point in the cube $C$ to the origin. This average is given by the integral $$ \frac{1}{8} \iiint_C (|x|+|y|+|z|)\, dV . $$ Denote by $C_1$ the part of the cube $C$ which is in the first octant. The triple integral is calculated in Cartesian coordinates \begin{align*} \iiint_C (|x|+|y|+|z|)\, dV & = 8 \int_0^{1} \int_0^{1} \int_0^1 (x+y+z ) \, dx dy dz \\ & = 8 \left( \frac{1}{2} + \frac{1}{2} + \frac{1}{2} \right) \\ &= 12 \end{align*} Thus the average is $3/2.$
- Finally, let us find the average Euclidean distance of a point in the cube $C$ to the origin. This average is given by the expression $$ \frac{1}{8} \iiint_C \sqrt{x^2+y^2+z^2}\, dV . $$ Denote by $P$ the following pyramid: $$ P = \bigl\{ (x,y,z) \in {\mathbb R}^3 \, | \, 0\leq x \leq 1, 0 \leq y \leq x, 0 \leq z \leq x\bigr\}. $$ The cube $C$ consists of $24$ pyramids that are congruent to the pyramid $P$. We will calculate the triple integral in spherical coordinates. For that we need to describe $P$ in spherical coordinates: $$ P = \left\{ (\rho,\theta,\phi) \, | \, 0 \leq \theta \leq \frac{\pi}{4}, \arctan\left(\frac{1}{\cos \theta}\right) \leq \phi \leq \frac{\pi}{2}, 0 \leq \rho \leq \frac{1}{(\cos \theta)(\sin \phi)}\right\}. $$ Now the integral is calculated as follows: \begin{align*} \iiint_C \sqrt{x^2+y^2+z^2}\, dV & = 24 \iiint_P \sqrt{x^2+y^2+z^2}\, dV \\ & = 24 \int_0^{\pi/4} \int_{\arctan\bigl(1/(\cos\theta)\bigr)}^{\pi/2} \int_0^{1/((\cos\theta)(\sin\phi))} \rho^3 (\sin \phi) d\rho d\phi d\theta \\ &= 6 \int_0^{\pi/4} \int_{\arctan\bigl(1/(\cos\theta)\bigr)}^{\pi/2} \frac{1}{ (\cos\theta)^4(\sin\phi)^3}d\phi d\theta \\ &= 6 \int_0^{\pi/4} \frac{1}{ (\cos\theta)^4} \int_{\arctan\bigl(1/(\cos\theta)\bigr)}^{\pi/2} \frac{\sin \phi}{ (\sin\phi)^4}d\phi d\theta \\ &= 6 \int_0^{\pi/4} \frac{1}{ (\cos\theta)^4} \int^{\arctan\bigl(1/(\cos\theta)\bigr)}_{\pi/2} \frac{d(\cos \phi)}{ (1-(\cos\phi)^2)^2} \, d\theta \\ &= 6 \int_0^{\pi/4} \frac{1}{ (\cos\theta)^4} \int^{\frac{\cos\theta}{\sqrt{1+(\cos\theta)^2}}}_{0} \frac{du}{ (1-u^2)^2} \ d\theta \\ &= 6 \int_0^{\pi/4} \frac{1}{ (\cos\theta)^4} \left(\frac{u}{2(1-u^2)} +\frac{1}{4} \ln\left(\frac{1+u}{1-u}\right)\right) \Biggl.\Biggr|^{\frac{\cos\theta}{\sqrt{1+(\cos\theta)^2}}}_{0} \ d\theta \\ &= 3 \int_0^{\pi/4} \left( \frac{\sqrt{1+(\cos\theta)^2}}{(\cos\theta)^3} +\frac{1}{2} \frac{1}{(\cos\theta)^4} \ln \left(\frac{\sqrt{1+(\cos\theta)^2} +\cos\theta }{\sqrt{1+(\cos\theta)^2} -\cos\theta}\right)\right) \ d\theta \\ &= 3 \int_0^{\pi/4} \left( \frac{\sqrt{1+(\cos\theta)^2}}{(\cos\theta)^3} + \frac{1}{(\cos\theta)^4} \ln \left( \sqrt{1+(\cos\theta)^2} +\cos\theta \right)\right) \ d\theta \\ \end{align*} This is the best I could do by hand. These two integrals are difficult to do by hand. Mathematica gives $$ \int_0^{\pi/4} \frac{\sqrt{1+(\cos\theta)^2}}{(\cos\theta)^3} \ d\theta = \frac{1}{2}\left(\sqrt{3} + \ln\bigl(2+\sqrt{3}\bigr)\right) $$ and $$ \int_0^{\pi/4} \frac{1}{(\cos\theta)^4} \ln \left( \sqrt{1+(\cos\theta)^2} +\cos\theta \right) \ d\theta = -\frac{\pi}{9} +\frac{1}{6}\left(\sqrt{3} + \ln\bigl(362+209\sqrt{3}\bigr) \right) $$ Thus the volume is $$ -\frac{\pi}{3} + 2 \sqrt{3} +\frac{1}{2} \ln\bigl(18817+10864\sqrt{3}\bigr) \approx 7.68474 $$ and the average distance is $$ -\frac{\pi}{24} + \frac{\sqrt{3}}{4} +\frac{1}{16} \ln\bigl(18817+10864\sqrt{3}\bigr) \approx 0.960592 $$
-
For example: What is the average distance of a point in a unit disk to its center? Let $D$ be the unit disc centered at the origin. The average distance is $(1/\pi) \iint_D \sqrt{x^2+y^2}dA$. The double integral involved is the volume below.
-
I used Mathematica today to provide a virtual manipulative for calculating double integrals.
-
Today in class I created
this Mathematica file. The file is called 20170331_Slices.nb. Right-click on the underlined link; in the pop-up menu that appears, your browser will offer you to save the file in your directory. Make sure that you save it with the exactly same name. After saving the file you can open it with Mathematica 8. You will find Mathematica 8 on computers in BH 215. Look in
Start -> All Programs -> Wolfram Mathematica -> Mathematica 8. Open Mathematica first, then open 20170331_Slices.nb from Mathematica. - More information on how to use Mathematica version 8 you can find on my Mathematica 8 page.
- I also made a pdf printout of the Mathematica file 20170331_Slices.nb so that you can view it without having access to Mathematica.
- Below is an animated gif file illustrating iterated integration of the function $\sqrt{xy}$ over the region $$ \bigl\{ (x,y) \in {\mathbb R}\times{\mathbb R} \, : \, 0 \leq x \leq 1, \ 0 \leq y \leq 1-x \bigr\}. $$
Place the cursor over the image to start the animation.
-
Today in class I created
this Mathematica file. The file is called 20170331_Slices.nb. Right-click on the underlined link; in the pop-up menu that appears, your browser will offer you to save the file in your directory. Make sure that you save it with the exactly same name. After saving the file you can open it with Mathematica 8. You will find Mathematica 8 on computers in BH 215. Look in
- The information sheet
- We will start by reviewing Chapter 16. Do these problems
- The assigned problems for 16.1 are 1, 3, 6-11, 13.
- The assigned problems for 16.2 are 1-27 (do most), 32, 33, 34, 35, 41, 42, 43, 44, 53, 54, 56, 58, 59, 60.
- The assigned problems for 16.3 are 1-4, 5, 7, 8, 11, 12, 14-18, 19-27, 35, 37, 39, 43, 45, 49, 50, 51, 52, 60-62, 59, 63, 64
- The assigned problems for 16.4 are 1-8, 9, 12-15, 16-22, 25, 27, 28, 31, 33, 34, 35 (but do evaluate the area), 36
- The assigned problems for 16.5 are 1-20 (all, but in particular 9, 10, 11, 19, 20), 19-20 (and evaluate the integrals), 21-23, 24-28, 29-34, 36, 37, 38, 39, 42, 43, 48, 49, 52, 56
- Some relevant Chapter 16 Review exercises and problems are 17, 21, 23, 63, 64.
- As we indicated today we will be using Mathematica in this class. We will be using Mathematica 8 which is available in BH 215 and CF 312. To get started with Mathematica visit my Mathematica page. There are several links to Wolfram's movies that are an easy introduction to this software.