- This is what I wrote during the exam. Please let me know if you find errors.
- Here is a tentative list of topics for the final exam. I marked three topics that will definitely appear on the final.
- The assigned problems for 16.5 are 1-20 (all, but in particular 9, 10, 11, 19, 20), 21-35, 36, 37, 38, 40, 42-45, 47, 49-52, 55-58.
- Here are the current grades.
- This is what I wrote during the exam.
- The third exam is next Wednesday, November 25. It will cover Chapter 15 and Sections 16.1 through 16.4.
- The assigned problems for 16.3 are 1-4, 5, 7, 8, 11, 12, 16, 18, 20-23, 25, 27, 32, 35, 36, 37, 38-55, 57, 58.
- The assigned problems for 16.4 are 1-7, 9, 12-15, 16-19, 20, 22, 24, 25, 27, 28, 29, 31, 32, 33, 35.
- Some relevant Chapter 16 Review exercises and problems are 14, 19, 20, 48, 49.
- The assigned problems for 16.1 are 1, 3, 5, 7, 9-24 (do most), 26, 30, 31.
- The assigned problems for 16.2 are 1-28 (do most), 31-36, 38, 40, 41, 50-54.
- Here is the Mathematica file that I used today. It is called Integral.nb. Please make sure that it is saved with exactly this name. To see it follow the instructions given on October 16.
- All that we did in class on Problem 40 in Section 15.3 was correct. Here is a complete solutions with some other points that you can try.
- I find Problem 46 in Review of Chapter 15 very interesting. Here is my discussion of this problem. It is amazing how these optimization problems often end up with some symmetric solution. In this problem the symmetry was not obvious at first.
- Problem 46 in Review of Chapter 15 reminded me of the following important problem: Prove that among all triangles with a fixed area the equilateral triangle has the smallest perimeter. Here is a solution.
- The assigned problems for 15.3 are 1-18 (do most, in particular 8, 14, 15, 17), 19, 20, 22, 24, 25, 26, 28, 33, 38, 40.
- The assigned review problems for Chapter 15 are 7, 9, 11, 13, 17, 18, 19, 26, 27, 28, 32(a),(b), 37, 46.
- We will do 15.3 tomorrow. The assigned problems are 1-18 (do most, in particular 8, 14, 15, 17), 19, 20, 22, 24, 25, 26, 28, 33, 38, 40.
- It turns out that Problem 14 in Section 15.2 is really interesting. Here is a pdf file with my solution.
- Here is the Mathematica file that I used today. It is called GlobalExtrema.nb. Right-click on the underlined word "Here"; in the pop-up menu that appears, your browser will offer you to save the file in your directory. Make sure that the file is saved with exactly this name: GlobalExtrema.nb. After saving the file you can open it with Mathematica.
- This is what I wrote during the exam, with few remarks added while grading.
- We will do 15.2 tomorrow. The assigned problems are 1-15, 18-25, 27-30.
- We started 15.1 today. The assigned problems are 1-18, 20, 24 - 29, 34.
- The second exam on Wednesday. It covers 13.4, 14.1 through 14.7, and 15.1.
- Updated notes on Chapter 14. We started 12.5 today. So, that is the homework for the weekend.
- We did Section 14.3 today. Here is the Mathematica file that I used today. It is called String.nb. It contains a simple animation. To see it you have to evaluate the notebook following the instructions given on October 16.
- Here is the Mathematica file that I used today. It is called ParDerPlots.nb.
- Here is another Mathematica file with some instructions how to do plots in Mathematica. The file is called ClassPlots.nb.
-
Here is the Mathematica file that I used today. It is called VectorsInColor.nb. Right-click on the underlined word "Here"; in the pop-up menu that appears, your browser will offer you to save the file in your directory. Make sure that the file is saved with exactly this name: VectorsInColor.nb. After saving the file you can open it with Mathematica. You will find Mathematica in on campus computers in
Start -> All Programs -> Math Applications -> Mathematica. Open Mathematica first, then open VectorsInColor.nb from Mathematica. Sorry there are no explanations in the file. You can execute entire file by following the manu sequence (in Mathematica):Kernel -> Evaluation -> Evaluate Notebook. You can execute Mathematica commands in the file by pressing Shift+Enter. This will give you some idea how Mathematica operates. -
There are four models of the Color Cube here:
- The first: It is in fact the white cube; (a good practice for your paper folding skills)
- The second: The black has taken over three sides;
- The third: Each of the eight vertices is appropriately colored;
- The fourth: Let a thousand flowers bloom: enjoy the outside of the color cube and imagine the inside.
- Notes on Chapter 14 (Sections 1 through 4).
- This is what I wrote during the exam.
- Here is the Mathematica file that I used today. It is called Triangle.nb. Right-click on the underlined word "Here"; in the pop-up menu that appears, your browser will offer you to save the file in your directory. After saving the file you can open it with Mathematica, as explained below. You can execute Mathematica commands in the file by pressing Shift+Enter. This will give you some idea how Mathematica operates.
- Read Section 13.4 for Monday. The exam is on Wednesday and it will include 13.4.
-
This problem is inspired by Problem 37 in Section 13.1 and the Wikipedia page about the
hexagonal lattice
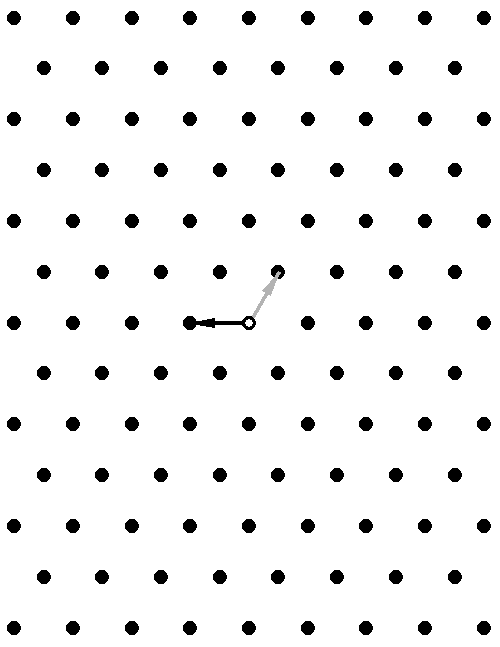
There are two unit vectors in the first and second picture below. They are
u = - i and v = (1/2) i + (sqrt(3)/2) j.
The vector u is the black vector and v is the gray vector.- This item relates to the first picture. I claim that the position vector of each point in the first picture can be expressed as a sum of integer multiples of the vectors u and v . I know that this is true since that is how I created the picture. Select several specific points (the more points the better) in this picture and confirm that my claim is true for those points by giving the specific integers in question.
- In the second picture I colored the points from the first picture red, green and blue according to a certain pattern. Discover the pattern that I used for coloring. Your explanation of the pattern must be clear and must involve the integers that were mentioned in the first item of this problem.
- I created the third picture by using the coloring from the second picture and the vectors u and v and a third vector. Do you see which third vector I used and how? Please explain clearly.
- Again, I created the fourth picture by using the coloring from the second picture and a certain patten. Do you see the pattern that I used to color the hexagons. The pattern is similar to the pattern discovered in the second item. The explanation must involve the integers from the first item. Explain clearly.
Click on the image to see the next one.
-
Here is the Mathematica file that I used today. It is called VectorsInMate.nb. I fixed the problems with download that you had before. Now the following procedure should work properly. Right-click on the underlined word "Here"; in the pop-up menu that appears, your browser will offer you to save the file in your directory. After saving the file you can open it with Mathematica. You will find Mathematica in on campus computers in
Start -> All Programs -> Math Applications -> Mathematica. Open Mathematica first, then open Plots.nb from Mathematica. Sorry there are no explanations in the file. You can execute entire file by following the following manu sequence (in Mathematica):Kernel -> Evaluation -> Evaluate Notebook. - Finally, here you can find problems for Chapter 13.
- Notes on Chapter 13
- Here is the Excel spreadsheet that I used in class today. An xls version is here. This is how I see vectors arising in the Excel setting. In the file that you can download, I have random numbers in the cell range A1:E5. In the cell K4 I put the formula =A1. In this way I have determined a "cell displacement vector": "look 10 cells left and 3 cells up". When I copy the cell K4 to the clipboard, what Excel remembers is this displacement: "look 10 cells left and 3 cells up". So when I paste at the cell L4, then "look 10 cells left and 3 cells up" means B2. Analogously, for all the cells in the range K4:O8. I repeat the same procedure for the cell range C13:G17. Here the displacement vector is "2 cells left and 12 cells up".
-
Today in class I demonstrated few 3-d plots in Mathematica. Here is the Mathematica file that I used. It is called Plots.nb. As before, right-click on the underlined word "Here"; in the pop-up menu that appears, your browser will offer you to save the file in your directory. After saving the file you can open it with Mathematica. You will find Mathematica in on campus computers in
Start -> All Programs -> Math Applications -> Mathematica. Open Mathematica first, then open Plots.nb from Mathematica. Sorry there are no explanations in the file. You can execute entire file by following the following manu sequence (in Mathematica):Kernel -> Evaluation -> Evaluate Notebook. I will post more Mathematica instructions later. - You can also explore discontinuous functions in Excel. I post two functions: Here is a function that they used in the textbook and here is the function that I used in class. And, both functions in Excel 97-2003 are here and here.
- If you have problems running or understanding these files please let me know. At the same time you can enhance the understanding of math that you are learning and learn the basics of these programs.
- Here are some good Java applets for exploration of functions of two variables. At the end is a comprehensive list of web math tools from MIT.
- Today in class we did a problem of finding an equation of the plane which contains three given points. In the problem we did two of the given points had the same x-coordinate and two of the given points had the same y-coordinate. This fact made our problem quite simple. Then I stated a different problem and said that we need tools from Chapter 13 (that is the cross product of two vectors) to solve that problem. It turns out that I was wrong. In this pdf file I suggest a relatively simple way to solve problems similar to one that I did not solve in class. Please make sure that you understand this method. This is definitely a potential exam problem.
-
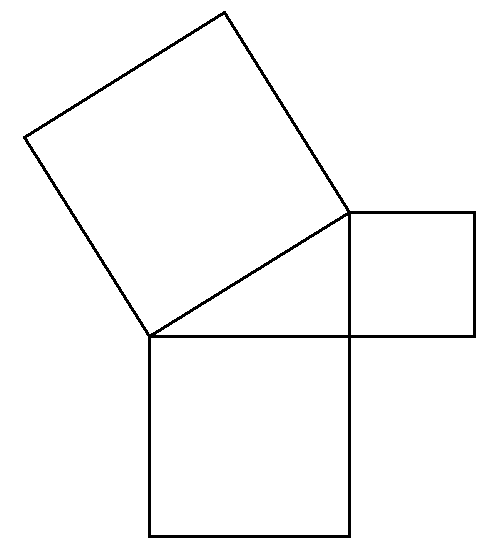
The proof of the distance formula in space is based on the Pythagorean theorem. In class I showed one proof of the Pythagorean theorem. Here is a slightly different visual proof.
The first three steps of the visual proof below are as follows:- The point in the first step is the center of the corresponding square.
- The line segment in the second step is parallel to the hypothenuse. Therefore its length is equal to the length of the hypothenuse. The center of the square is its midpoint.
- The line segment in the in the third step is orthogonal to the hypothenuse. In fact it is the line segment from the second step rotated around the center of the square for the right angle.
Click on the image for a visual proof of the Pythagorean theorem.
- Tomorrow we will do 12.4. Homework for today is 12.3. 12.3. For tomorrow its 12.4, and for the rest of the week 12.5, 12.6
- The Excel files which are compatible with Excel 97-2003 are added below.
-
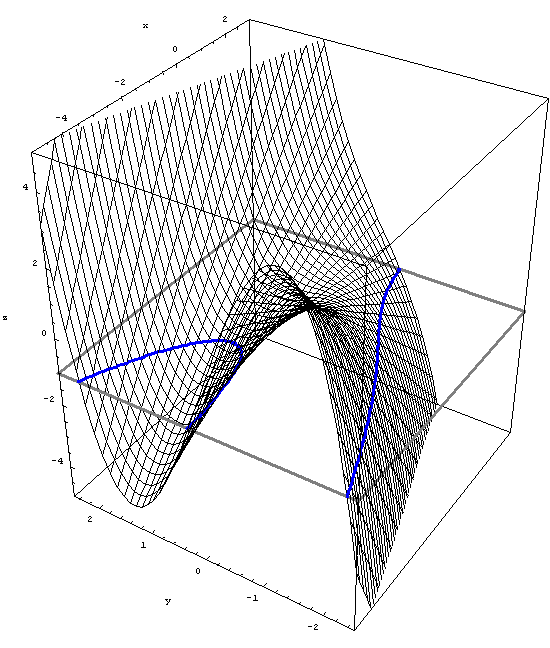
Here is an animation which shows level curves of the function z = y^3 + x*y.
Place the cursor over the image to start the animation.
-
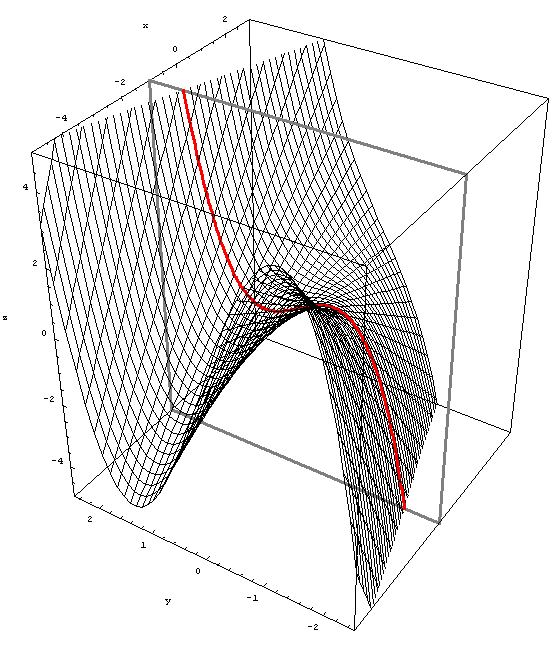
At the same time it is interesting to view the slices parallel to yz-plane and zx-plane. Here are the corresponding animations. The function is z = y^3 + x*y, as above.
Place the cursor over the image to start the animation.
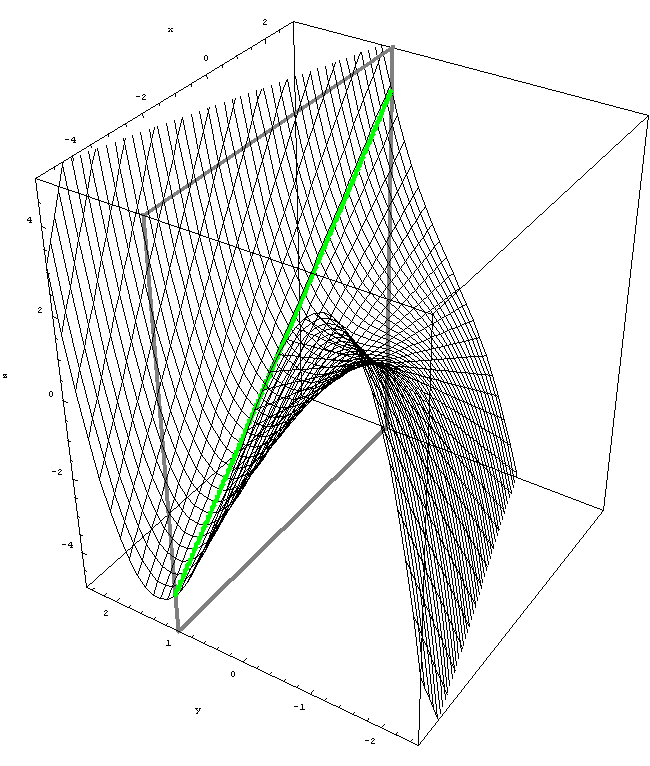
- Here is an Excel spreadsheet with the saddle function which was discussed in class on Friday. An older version is here.
- Excel is a handy tool for numerical problems. Sometimes it can be very helpful. In addition you are learning how to use a very popular business tool. Excel is available on all computers on campus. If you do not have your own copy of Excel you can use a free alternative: OpenOffice.
- To use the Excel files in the item below, right-click on the underlined word "Here"; in the pop-up menu that appears, your browser will offer you to save the file in your directory. After saving the file you can open it with Excel.
- Here is the Excel file that I wrote in class. Here is another Excel example. Older versions are here and here.
- Work on the exercises and problems for 12.1 and 12.2.
- Related Wikipedia links:
- Disk. Pay attention to the notation used here. That is standard mathematical notation that is unfortunately not used in our textbook.
-
Sphere. There is too much stuff here. Some of it we will cover later on. Still, you can recognize few equations on this page. Pay attention to the sentence:
In higher mathematics, a careful distinction is made between the surface of a sphere (referred to as a “sphere”), and the inside of a sphere (referred to as a “ball”).
In mathematics words do have precise meanings. I find this aesthetically very pleasing. - Euclidean distance. This page can give you a teste how the distance that we talked about today fits into a broader context.